Digital Technologies in
Hardness Testing
Test & INspection
Modern computer control of hardness testers has advanced far beyond making a single line of indents.
By Doug Ngai
Hardness testing is a simple mechanical test developed to provide a quantitative measurement in a quick and efficient manner. Hardness testing is used in place of other techniques such as tensile testing as it can be correlated with tensile strength but requires significantly less time and effort, as well as being comparatively nondestructive.
When Wilson first developed the Rockwell test in the early 20th century, the speed of testing drove rapid adoption of the technique, supporting the growth of production line manufacturing as well as high volume output of components needed for the war effort at the time. Various types of hardness test technique have been developed over the years, the most common examples being Rockwell, Vickers, Knoop and Brinell testing. Each has its unique advantages and limitations, but each has earned their place in today’s quality control environment due to the speed, accuracy, and reproducibility of the tests.
The digital age has already created many changes in hardness testing techniques. Load cells have largely replaced weights. Mechanical controls are now often motor driven. Visual measurement of indents – where needed – are automatically located, focused, and measured without human interaction.
The addition of automation in these areas has driven both repeatability and reproducibility of single hardness indents to new levels, allowing design boundaries to be pushed and control of manufacturing quality to be more exact. Another aspect of the digital age has been the introduction of the automated placement of hardness indents. This was initially driven by particular applications, such as surface heat treatment of gears, where a combination of a hard surface layer and a soft interior structure allows the gear components to withstand resist wear as well as high stress and fatigue in service. Automating the movement of a test specimen was introduced with computerization to more rapidly assess the changing hardness and ensure sufficient case depth is attained from the heat treatment process.

New Opportunities
As has always been true, new technologies drive new opportunities. Modern computer control of hardness testers has advanced far beyond making a single line of indents.
The best software packages can provide many tools for highlighting potential testing problems and/or adaptation of test programs to suit different components being tested. Functions such as the ability to automatically find edges of test pieces, scan an area of interest, snap indentation patterns to the correct location, review placement and adjust on the fly all provide ease of use and versatility to adapt to changing requirements without significant effort from the operator.
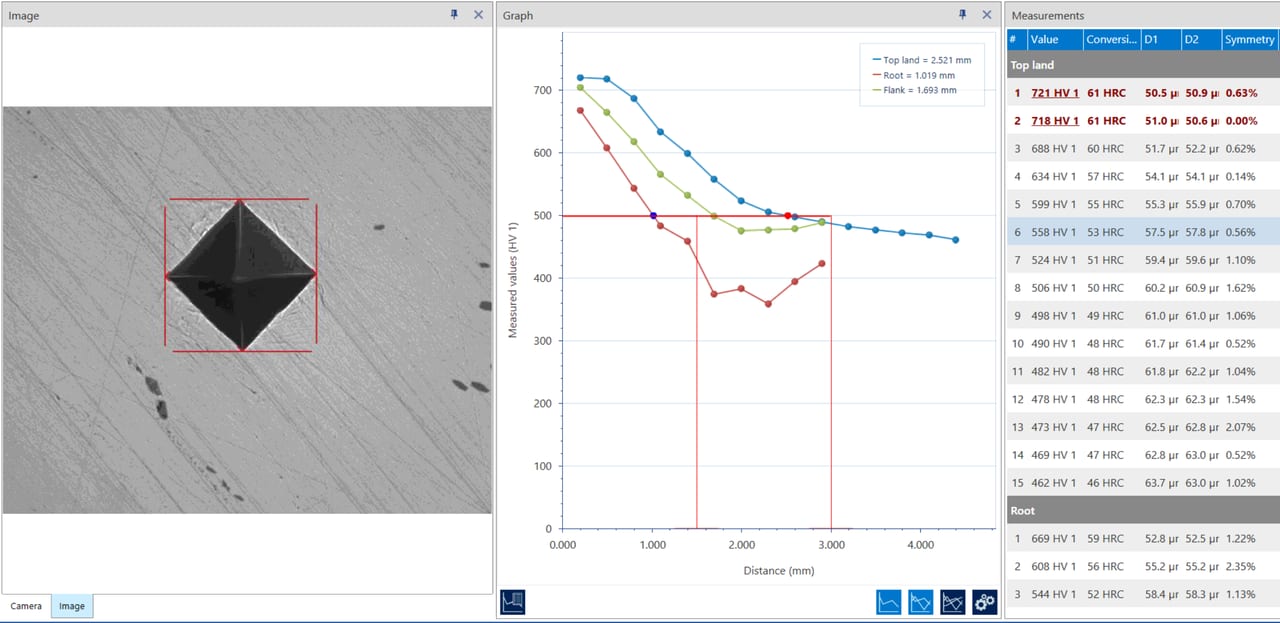
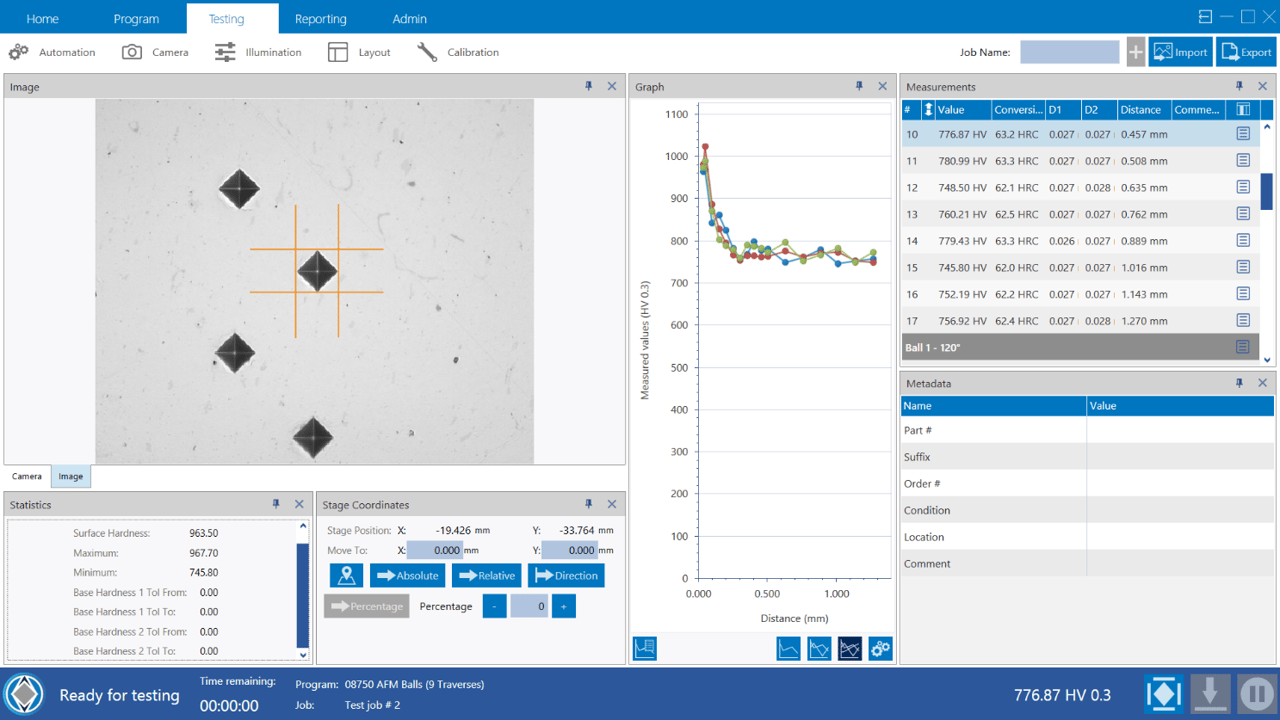
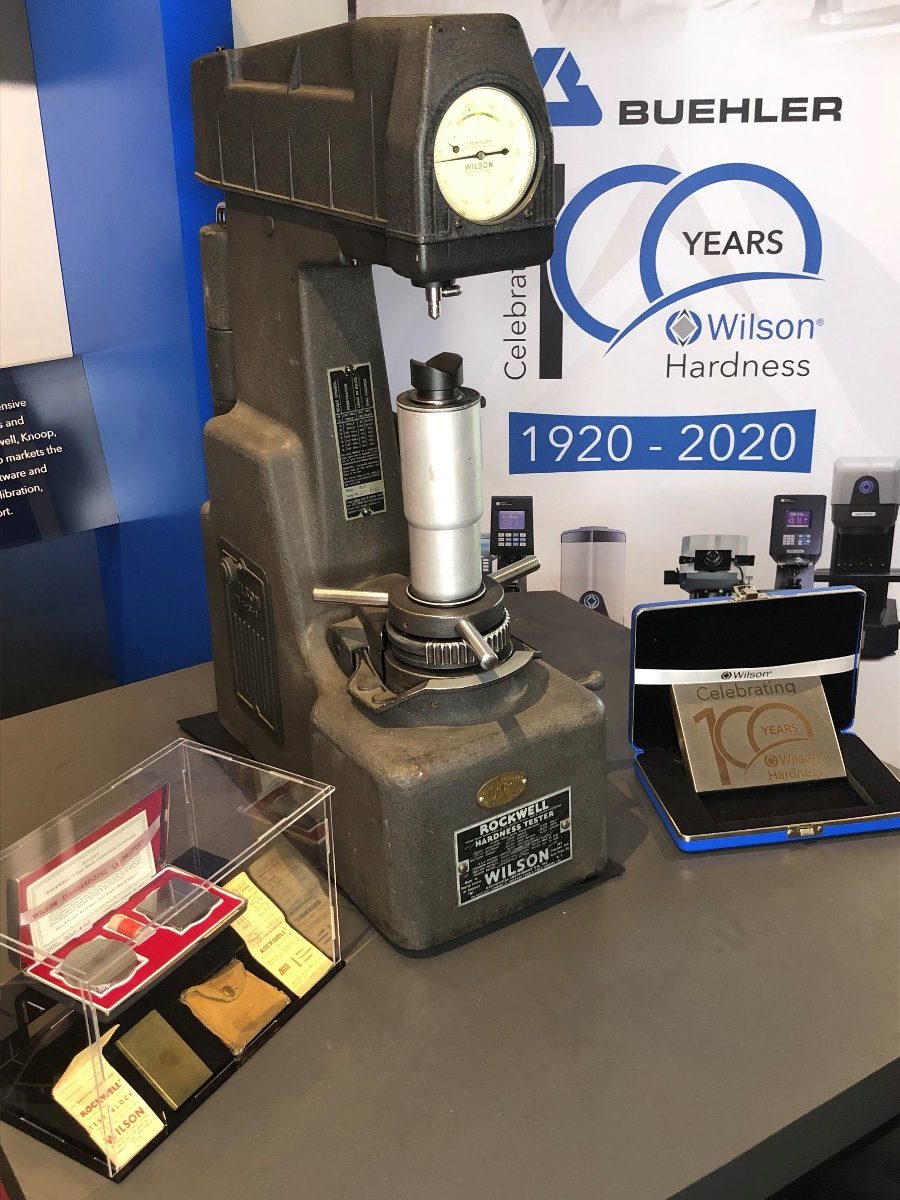
Figure 1: Early 20th century Rockwell hardness tester. Image Source: Buehler
Figure 2 – Vickers indent with Filar lines
Figure 3 – Case depth measurement
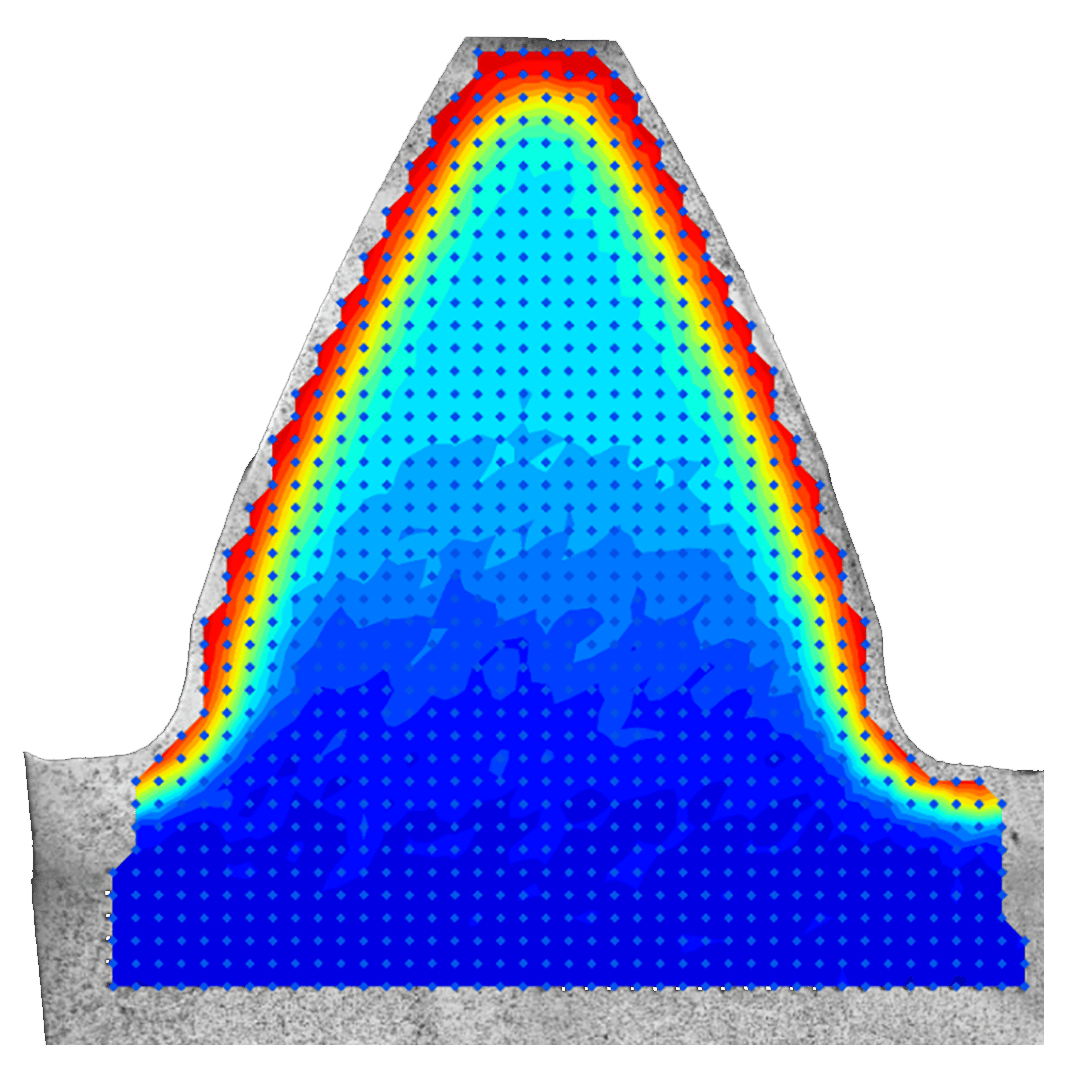
It’s now possible to ‘scan’ a sample and create a collage of indents to provide a wealth of detail on material hardness variation. The hardness map created literally adds a new dimension to any test data, providing a quick qualitative assessment of the heat treatment process, with the detailed quantitative data available if closer inspection is needed. Figure 4 shows hardness mapping of a gear tooth, allowing us to instantly see the depth of hardness penetration, and visualize any problems. This may not always be necessary in a quality control environment, but for development, failure analysis, setting up a new manufacturing process or for highest specification quality control this kind of analysis can be invaluable. The ability to visualize the hardness map, set maximum and minimum hardness values, and quickly identify anomalous indents makes these programs highly user friendly. Other tools help users conform to ASTM and ISO specifications. For example, virtual indent size overlay allows a user to easily assess minimum indent spacing compliance.
As well as offering improvements in our understanding of traditional applications such as this, these new capabilities open the door to whole new areas of analysis over a wide variety of applications. One such application area is joining technologies. There are a wide variety of methods used to join materials – many of which may be used in quality critical components. One of the best known and widely used joining technologies is welding. Typical quality control involves placing short lines of indents in specific areas across the weld, to identify process problems. The time taken to make multiple indents manually can be prohibitive, and so the placement of indents is limited to a few lines in strategic areas.

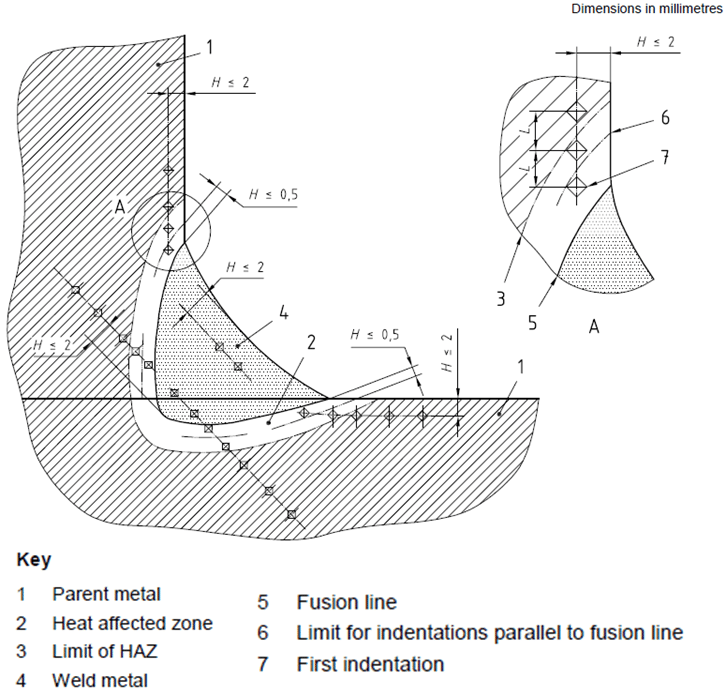
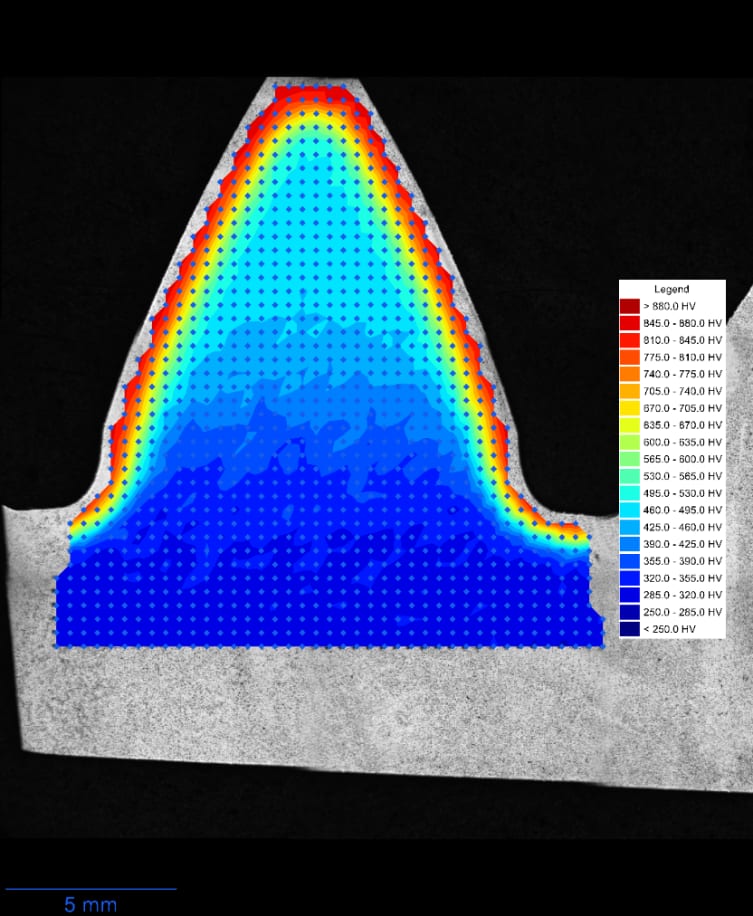
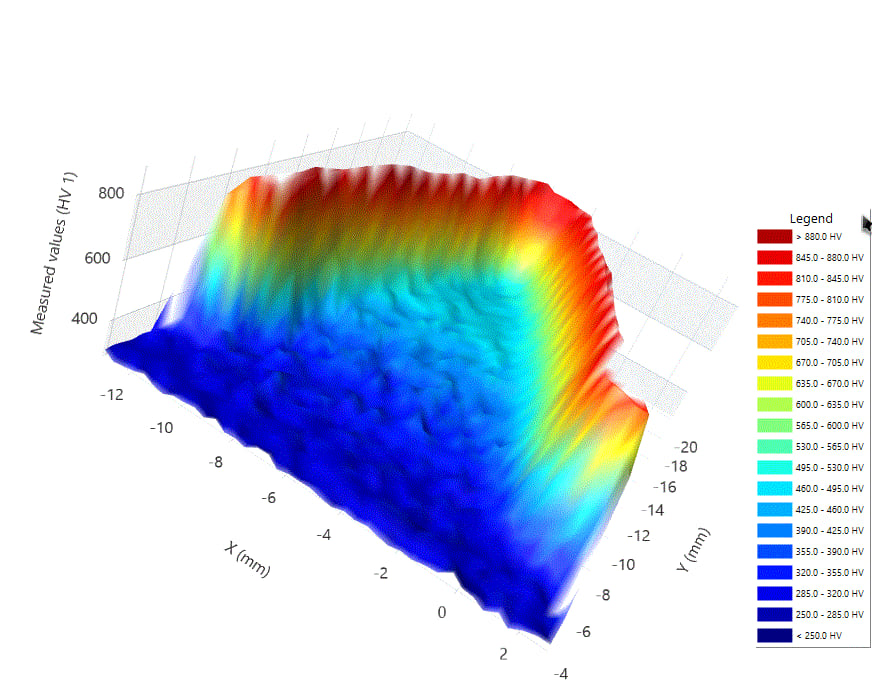
Figure 4: Hardness mapping on a gear tooth (a) 2d and (b) 3d
Figure 5: Example of hardness indent placements on a weld as per ISO 9015
Figure 6: Hardness mapping across a weld
Modern software can assist the user in making and placing these indents, but the values are typically then reviewed as tables or graphs with little capability to relate back to the component. This can leave open the possibility of missing a problem. Automated mapping across the whole weld area can actually reduce the amount of time an operator needs to set up tests. Indents can cover the whole area of interest, making the chance of missing a defect virtually nil. Hundreds of indents can be placed rapidly - thousands if needed – and all can be made and measured without any operator intervention. A quick review of the color-coded map can help the operator rapidly identify areas to investigate further.
All of these functions together also allow us to address more complex applications. One such application is self-piercing rivets (SPR). This technique allows sheets of material to be joined together with access from one side only, which has some significant advantages in manufacturing efficiency. The technique works by deforming the fastener and the sheet materials in a very precise way, such that they lock together. As the material is being deformed, the hardness is typically changed and can be used to characterize the joint. Automated area identification, placement, indentation, measurement and mapping allow the joint to be characterized quickly and effectively.
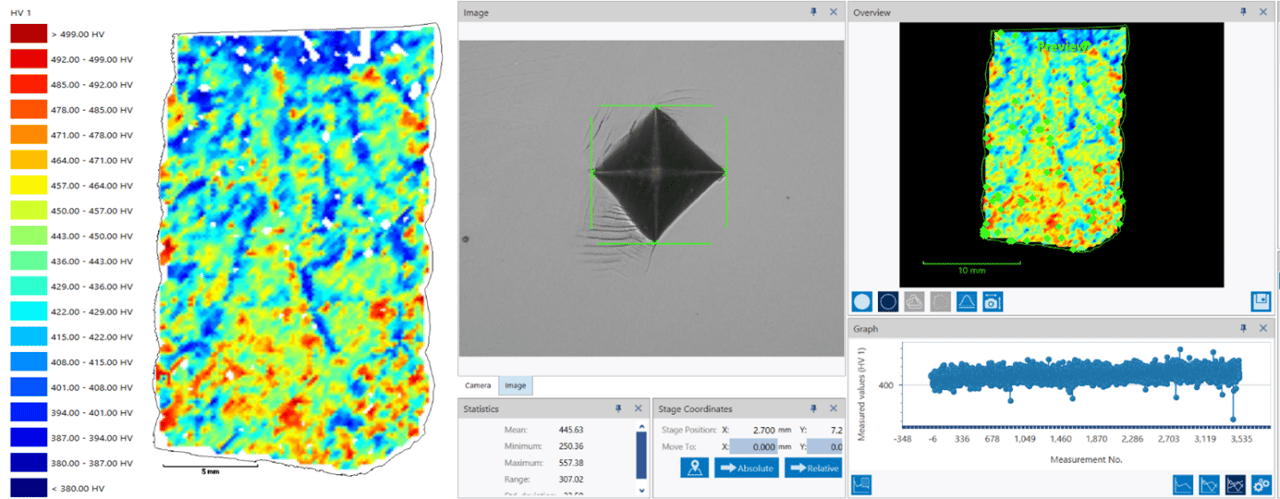
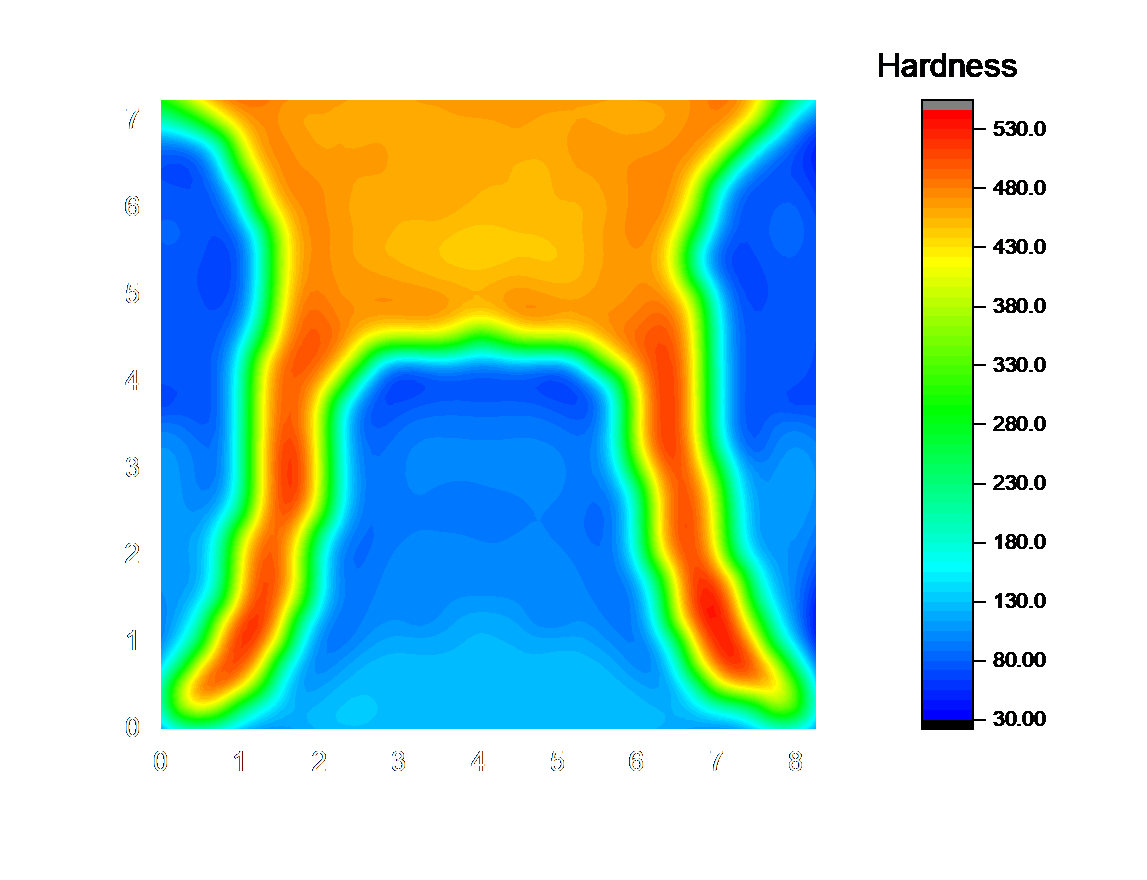
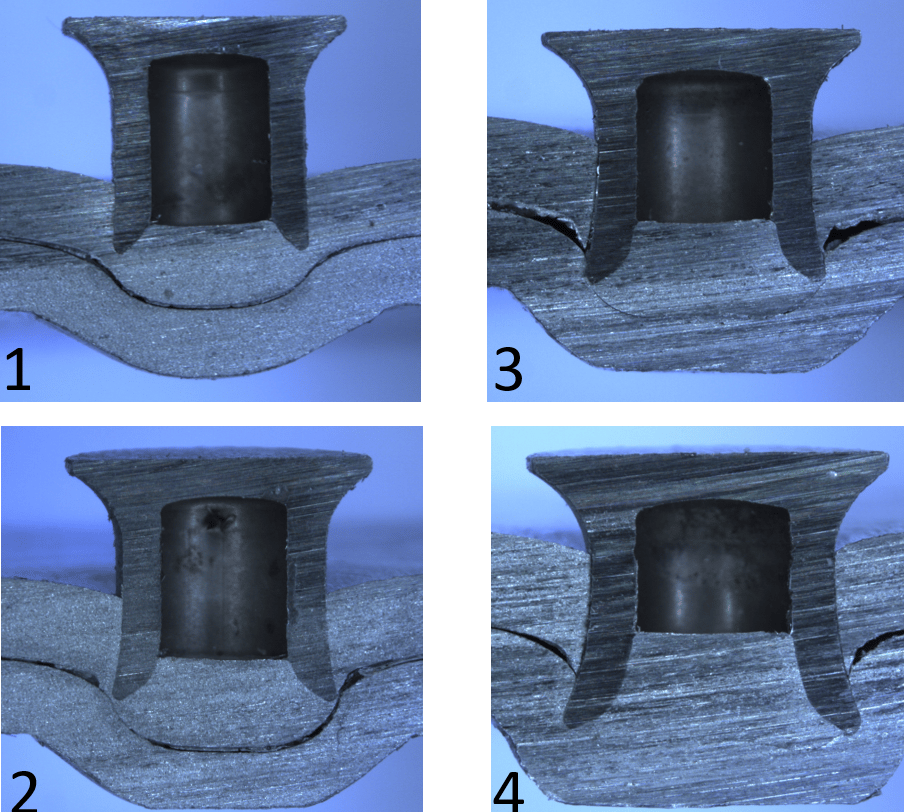
Figure 7: Self-piercing rivets
Figure 8: Hardness map across a self-piercing rivet
Figure 9: Hardness map on an additively manufactured component along build direction
Now we are entering the world of three dimensions in manufacturing. Additive manufacturing or 3D printing is being developed in virtually all manufacturing fields as the production technique of the future. Due to the nature of the process, quality control is also a three-dimensional problem. Material properties can change from area to area as the part is built up, and so the characterization of an area becomes much more important. Hardness mapping has been shown to be a valuable tool in analyzing additively manufactured samples. Figure 9 shows the change in properties of one such part, and a visible difference can be seen as the sample is built up.
The levels of automation and functionality in modern hardness testing systems provide us with new opportunities in measuring sample characteristics that only a few years ago were unattainable. The same tools have improved ease of use, efficiency, accuracy, and reproducibility - opening the door to new levels of quality control.
Opening Image Source: [Photographer Name]/[Collection Name] via Getty Images.
All Images Source: [Photographer Name]/[Collection Name] via Getty Images.
Doug Ngai, Buehler
October 2021 | Volume 60 | Number 10

Scroll Down
Scroll Down