H2 Deck By Bold Name
h2 xxxxxx
H1 xxxxxx
h2 xxxxx


Short run charts work for both variable and attribute data. By Jay Arthur
Short Run SPC
for Small Batch Manufacturing
Software & Analysis
H2 Deck Info By Paragraph Style Bold
Headline
At The Quality Show 2023 in Chicago, a number of attendees said they couldn’t do SPC (statistical process control) because they only do small batch (short run) production. This is a common misconception. While traditional SPC handles stability and capability over long production runs, short run SPC can handle high mix, low volume production as long as you are producing similar parts (e.g., different diameters of a similar part).
At The Quality Show we also spoke with a woman who works for a company that makes carriage and wagon tires for the Amish across America. Like bicycles, tires for the Amish range from thin racing tires to wide off-road tires. The company uses short run charts to ensure consistency when producing a dozen or more tires. If they can use short run charts to ensure product quality for the Amish, why can’t all small batch shops?
Short run charts work for both variable (i.e., measured) and attribute (counted) data. Tip: if the data has a decimal point, it is variable. Integers are most often attribute data.
Why Short Run SPC?
Why the demand for short production runs? Your customer’s application of Lean principles causes them to request smaller batch sizes which results in the need for shorter production runs and short run SPC.
There are two main types of short run charts: Z charts and difference charts. Z charts normalize the measurements into standard values that can be compared. Difference charts subtract a target or historical average value from each measurement, yielding a difference. The differences can be plotted as a control chart.
Using ZmR chart for Variable Data
ZmR charts normalize the data for each of the small batches. Normalizing the data lets you analyze different runs using a single control chart. Affordable SPC software will do this transformation for you and plot the results. Figure 1 shows an example of a ZmR chart for three different parts. There are no out-of-control points. The process is in control.
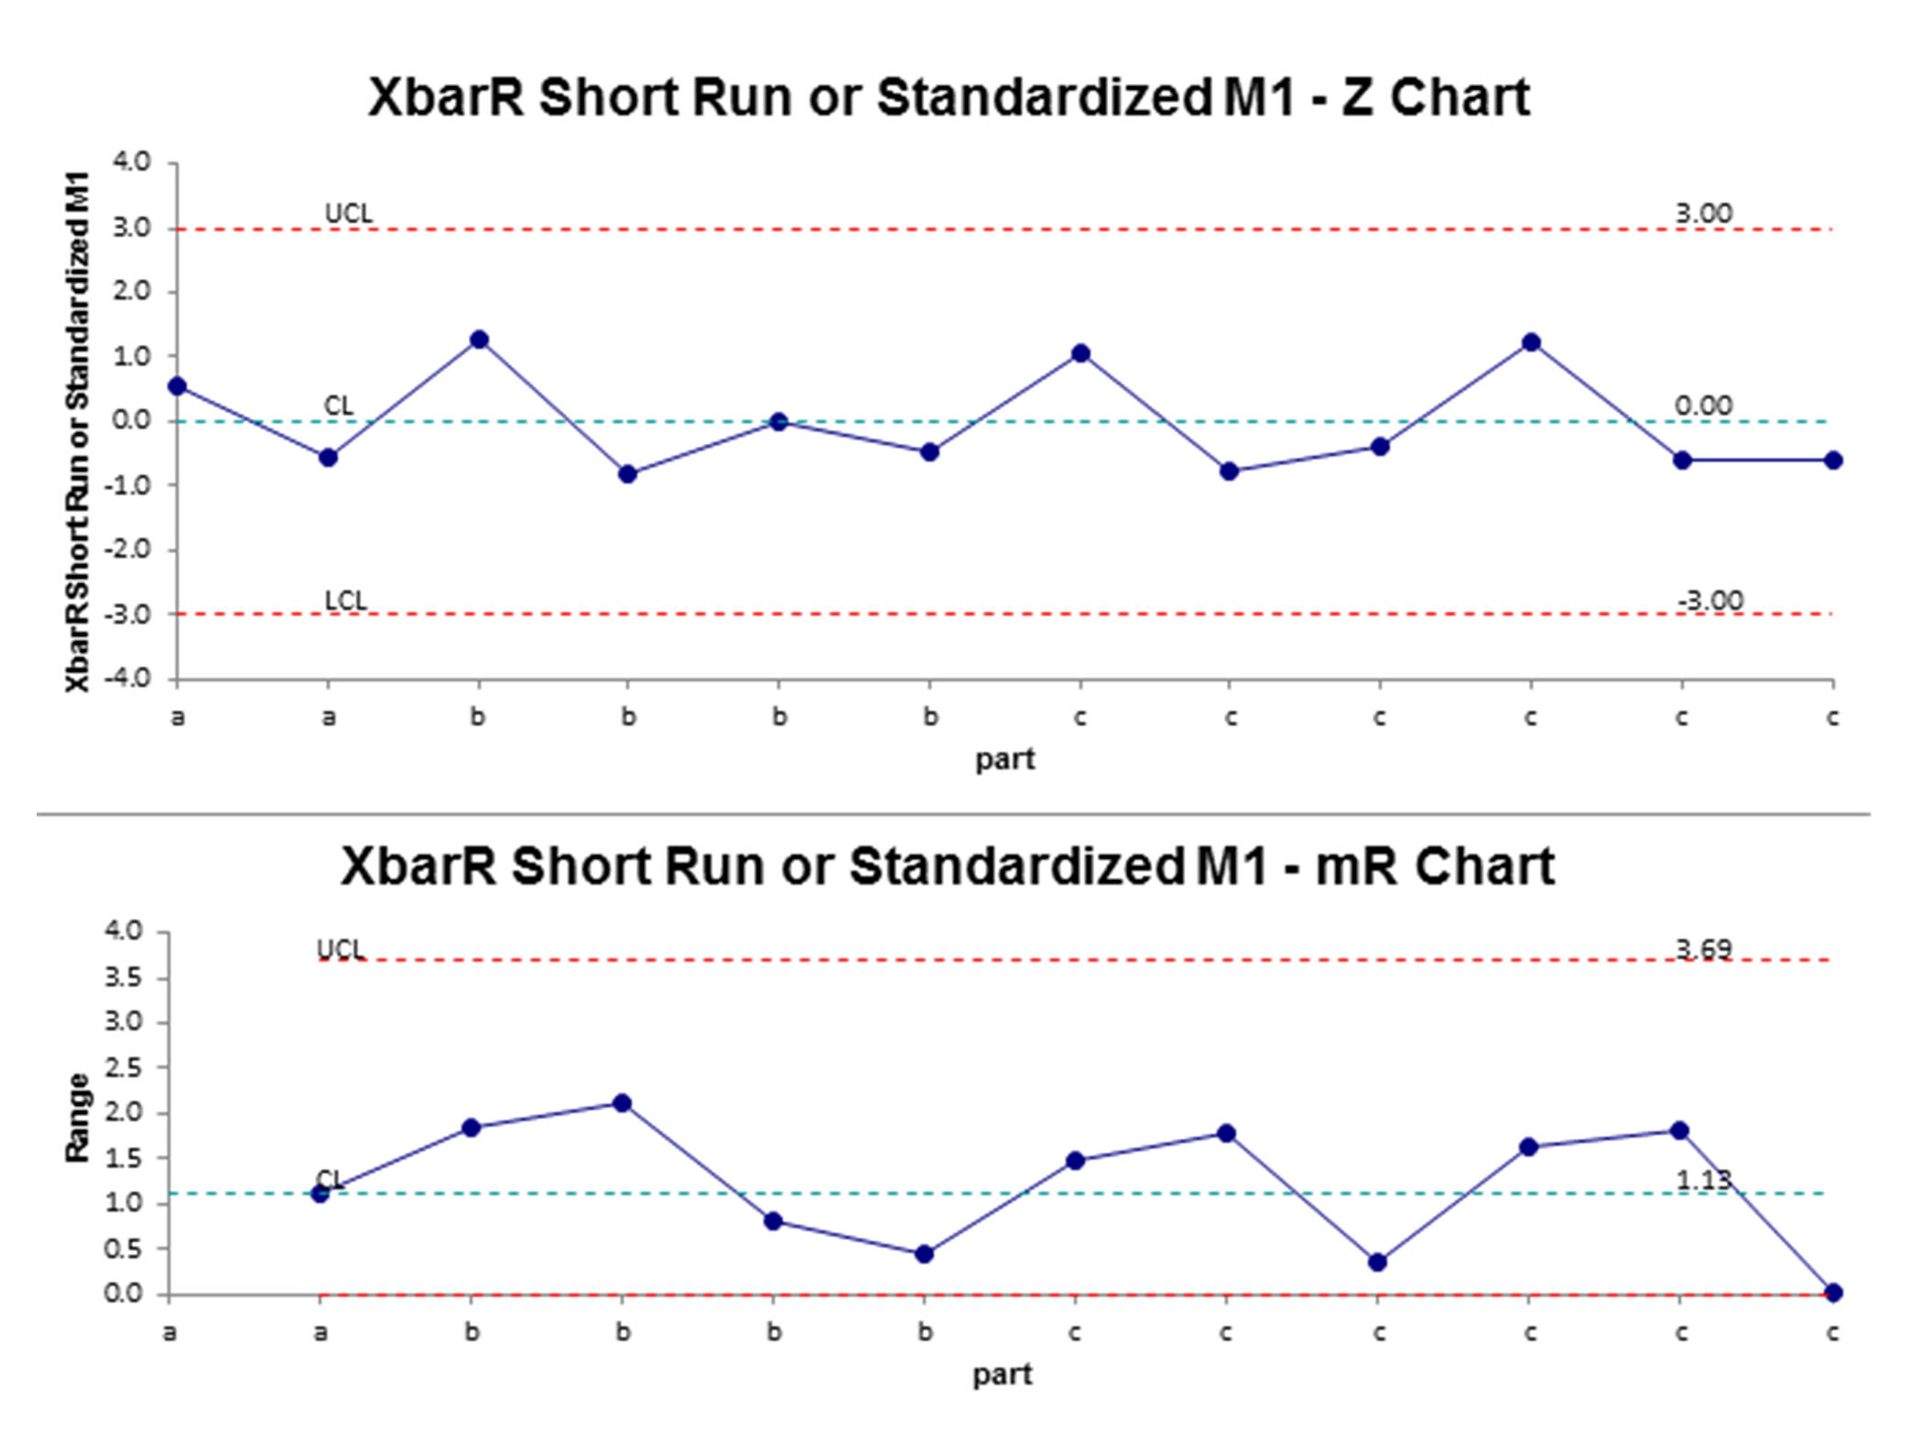
Figure 1: A depiction of how a skidded system’s hinged probe and a skidless system’s flat reference datum (surface) acquire data for measurements.
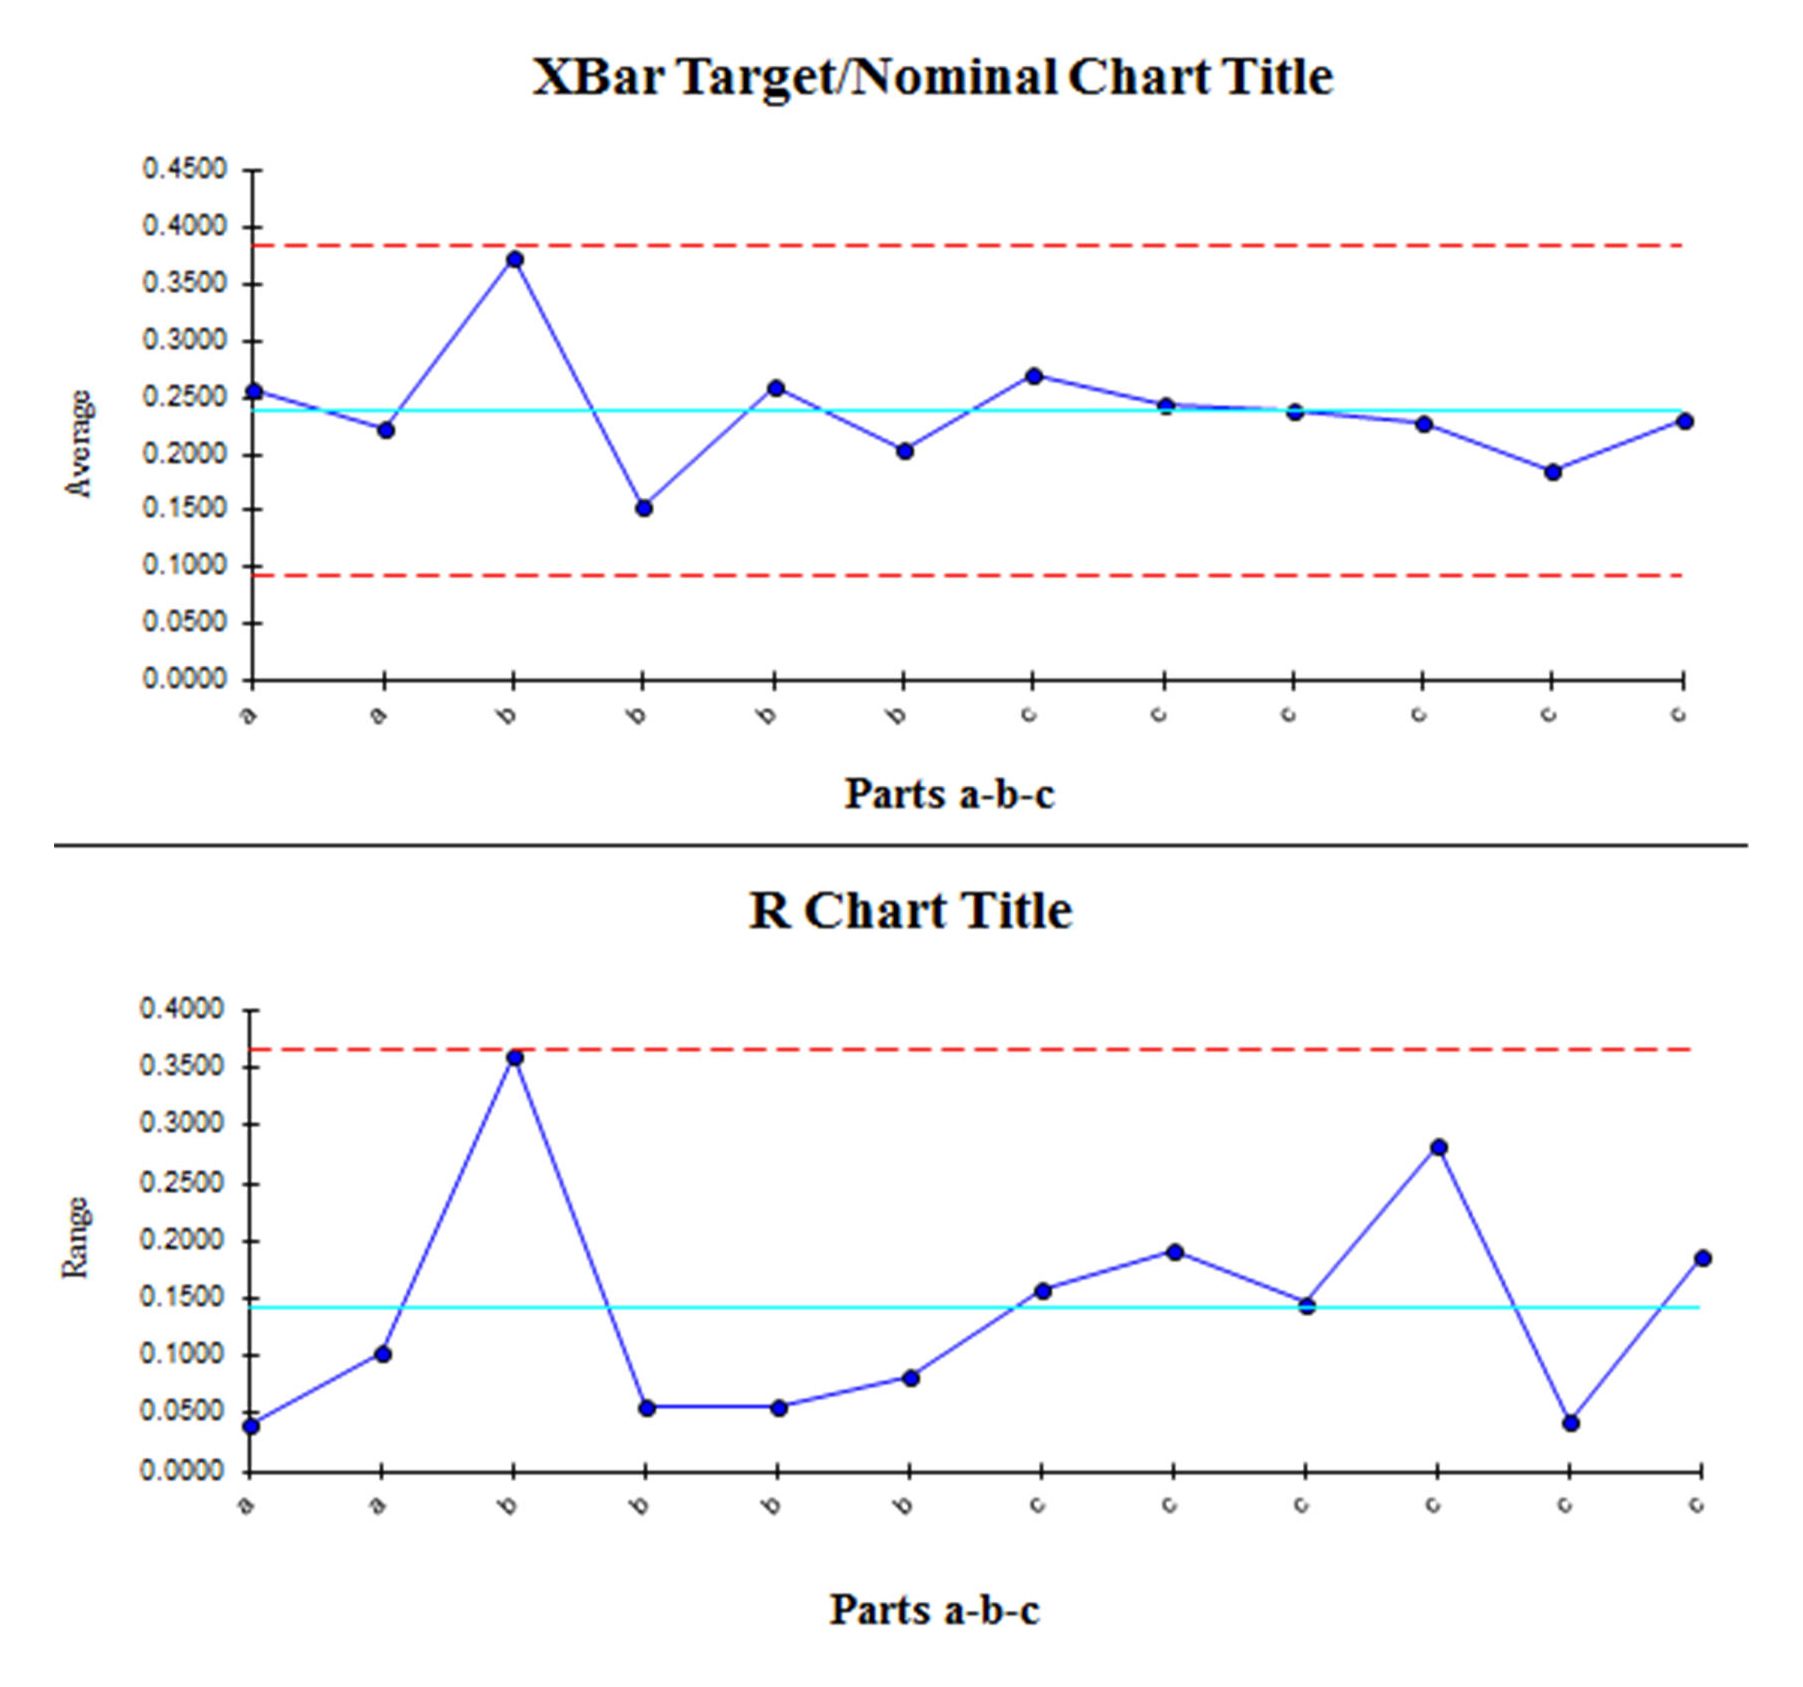
Difference Control Charts
Also known as Nominal or Target Charts, the measured values are adjusted by subtracting a target value which give the variation from the target. Figures 2-3 show an example of an XbarR chart using targets for three parts. Here again, the process is in control.
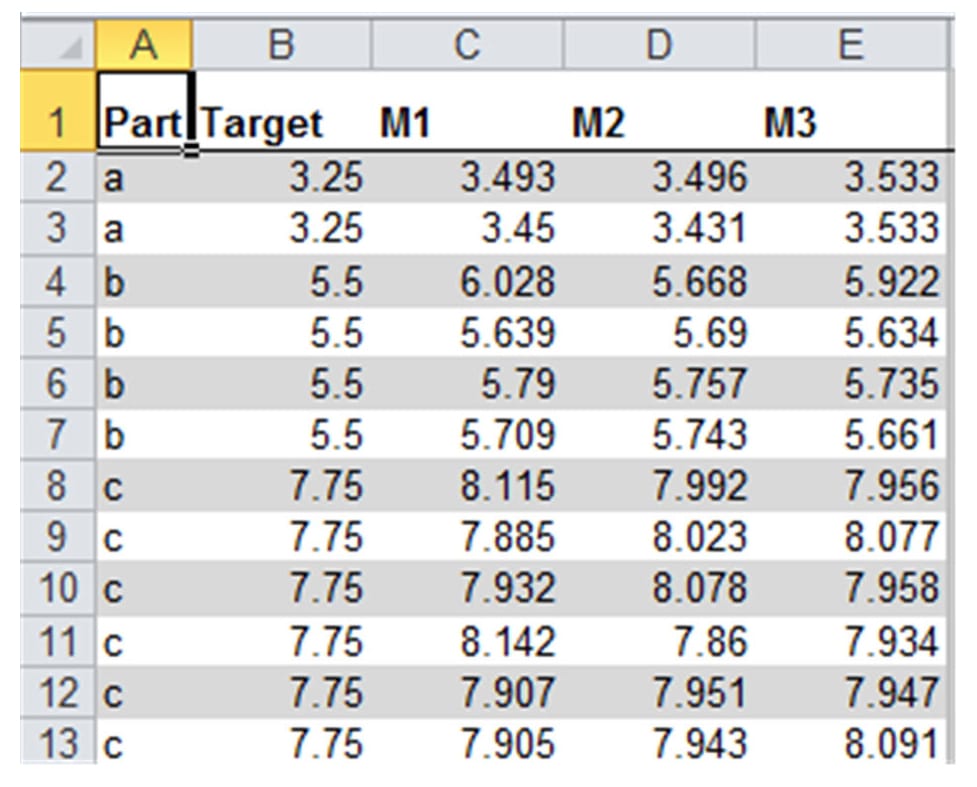
Figure 1: A depiction of how a skidded system’s hinged probe and a skidless system’s flat reference datum (surface) acquire data for measurements.
Short Run Charts for Attribute Data
Difference charts can also be used with attribute data. In this hypothetical example, bolt defects can have varying targets. While wildly out of spec, the process is control.
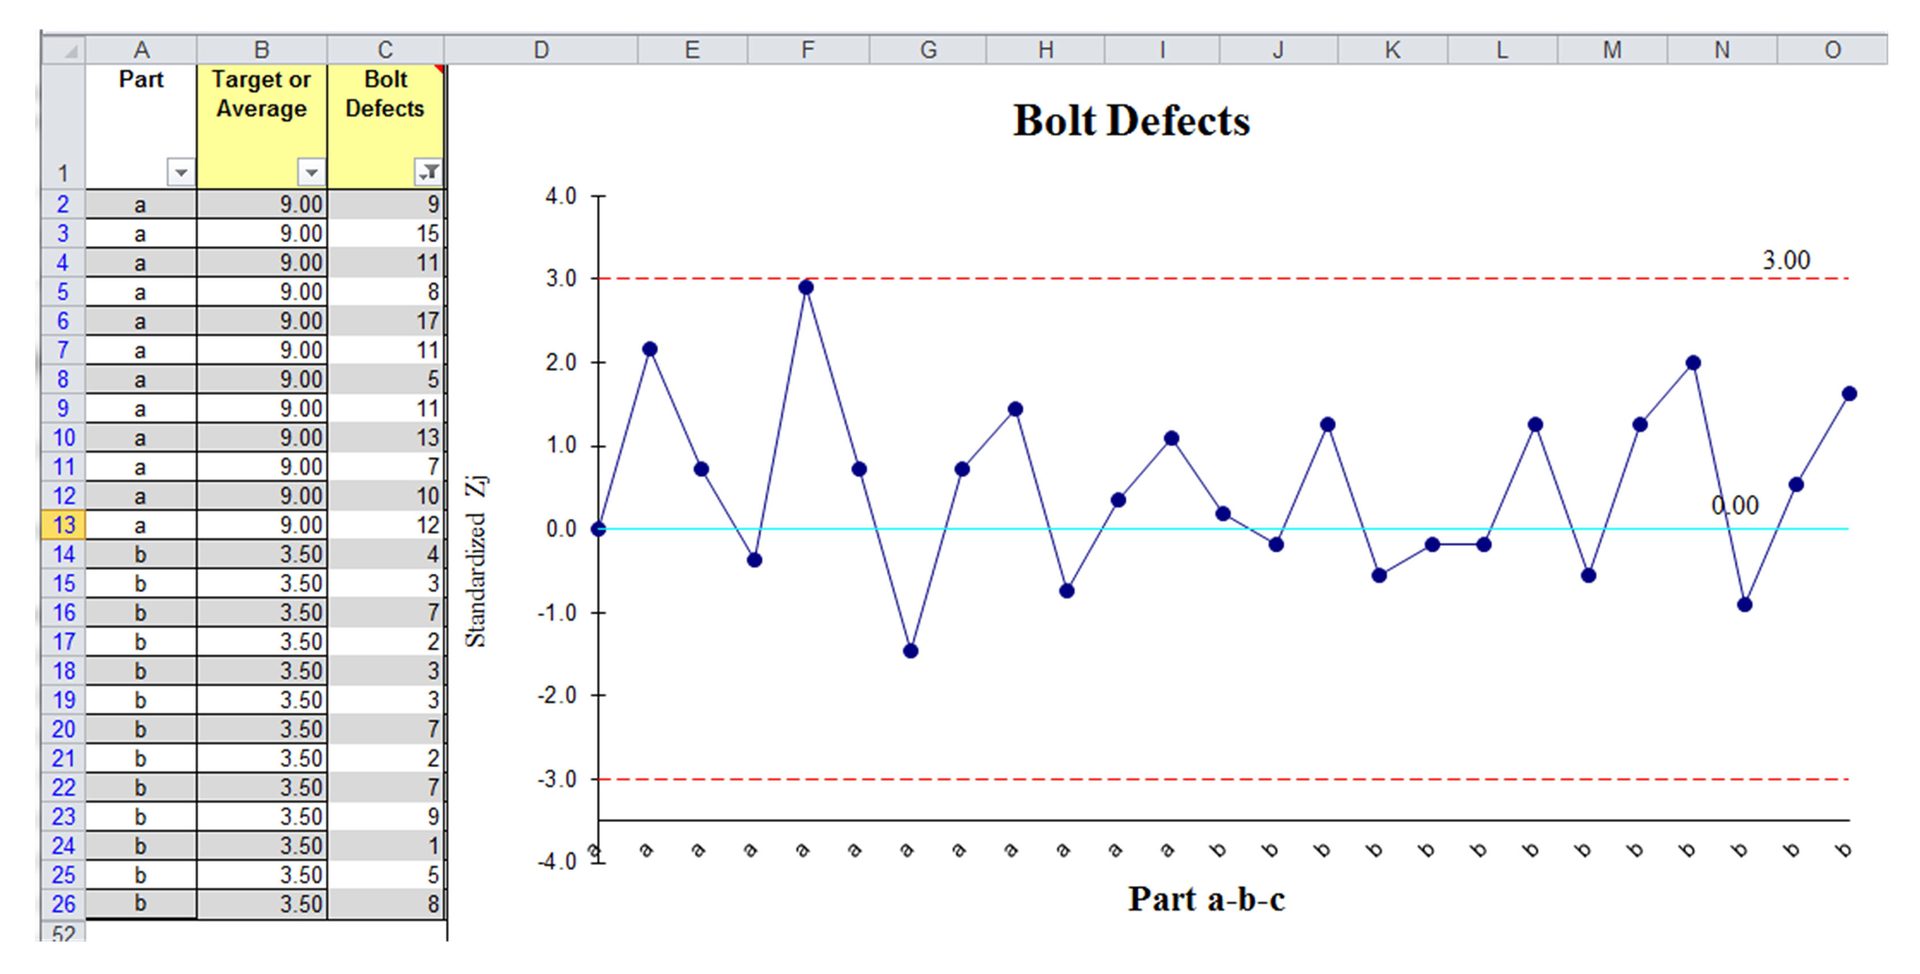
Figure 1: A depiction of how a skidded system’s hinged probe and a skidless system’s flat reference datum (surface) acquire data for measurements.
Short run SPC charts can assist any shop with analysis of their short production runs. It’s no more complicated than traditional SPC. You will need software to automate the analysis using Z charts or difference charts.
Opening Image Source: FG Trade / E+ via Getty Images.
Remaining Images Source: QI Macros
Jay Arthur is the author of Lean Six Sigma Demystified (2nd) McGraw-Hill and QI Macros SPC Software for Excel. He helped one manufacturing company save a million dollars in scrap. He can be reached at jay@qimacros.com and www.qimacros.com.
LINKS TO PAST Coverage: