GD&T’s New Rule
and What it means for Measurement
Measurement
Here we will explore the implications of rule “s” and the limits/requirements of today’s metrology as it is applied to these GD&T requirements.
By Mark C. Malburg, AJ Mennuti and Mike Zecchino
Rule “s” defines GD&T features in a way that makes them unmeasurable by commonly available metrology equipment—particularly in the case of large features. In this article we will explore the implications of rule “s” and the limits/requirements of today’s metrology as it is applied to these GD&T requirements.
Ramifications of the new fundamental rule “s”
Rule “s” specifies that the evaluation of GD&T features includes every aspect of a surface’s texture and flaws. When measuring straightness, say, one must include the roughness, pores, cracks, etc., within that measurement.
Many would argue that this has always been implied in the standards, though rule “s” states it directly for the first time. However, while rule “s” is intended to clarify the measurement of GD&T features, it ultimately leads to some untenable measurement conditions. All measurements require a tradeoff between sensor resolution (lateral and vertical), evaluation range, and measurement time. To detect the fine details required by rule “s” we find that we cannot measure large features with sufficient resolution, within a feasible amount of time, or with a manageable data set size.
Nevertheless, the standard needs to be addressed.
Using surface texture limits to define the measurable range
To address the rule “s” requirements we first need to agree on some lower end limit for the smallest features that can feasibly be included. We can all agree that most production measurement systems are incapable of measuring surface defects, say, to the molecular or atomic level. However, one approach we can consider is to include the features down to the scales that are typically considered “surface texture” as these are also required by rule “s”.
The ASME B46.1-2019 “Surface Texture” standard implies that, in most cases, surface texture begins at a wavelength of 2.5 micrometers. Wavelengths shorter than 2.5 micrometers are mostly filtered out of the data prior to analysis. It is interesting to note that ASME B46.1-2019 also indicates that surface flaws are not considered as part of surface texture.
Using this surface texture-based approach, we can consider that GD&T measurements would include features down to 2.5 micrometer wavelengths, but would exclude flaws smaller than 2.5 micrometers, as shown in Figure 1. This is not a pure interpretation of rule “s,” but it is the closest that we can reliably approximate it, given the current state of measurement art.
In Geometric Dimensioning and Tolerancing (GD&T) there has been a long-standing conflict between the worlds of specification and measurement. The goal of specification is to ensure that components will function; the goal of measurement is to ensure that manufactured components meet those functional requirements. The conflict often arises when design specifications are not easily assessed by available measurement technologies and procedures.
This conflict has been elevated with the release of ASME Y14.5-2018 and a new fundamental rule “s”:
Y14.5-2018 Section 4.1 (s)
Unless otherwise specified, elements of a surface include surface texture and flaws (e.g., burrs and scratches). All elements of a surface shall be within the applicable specified tolerance zone boundaries.
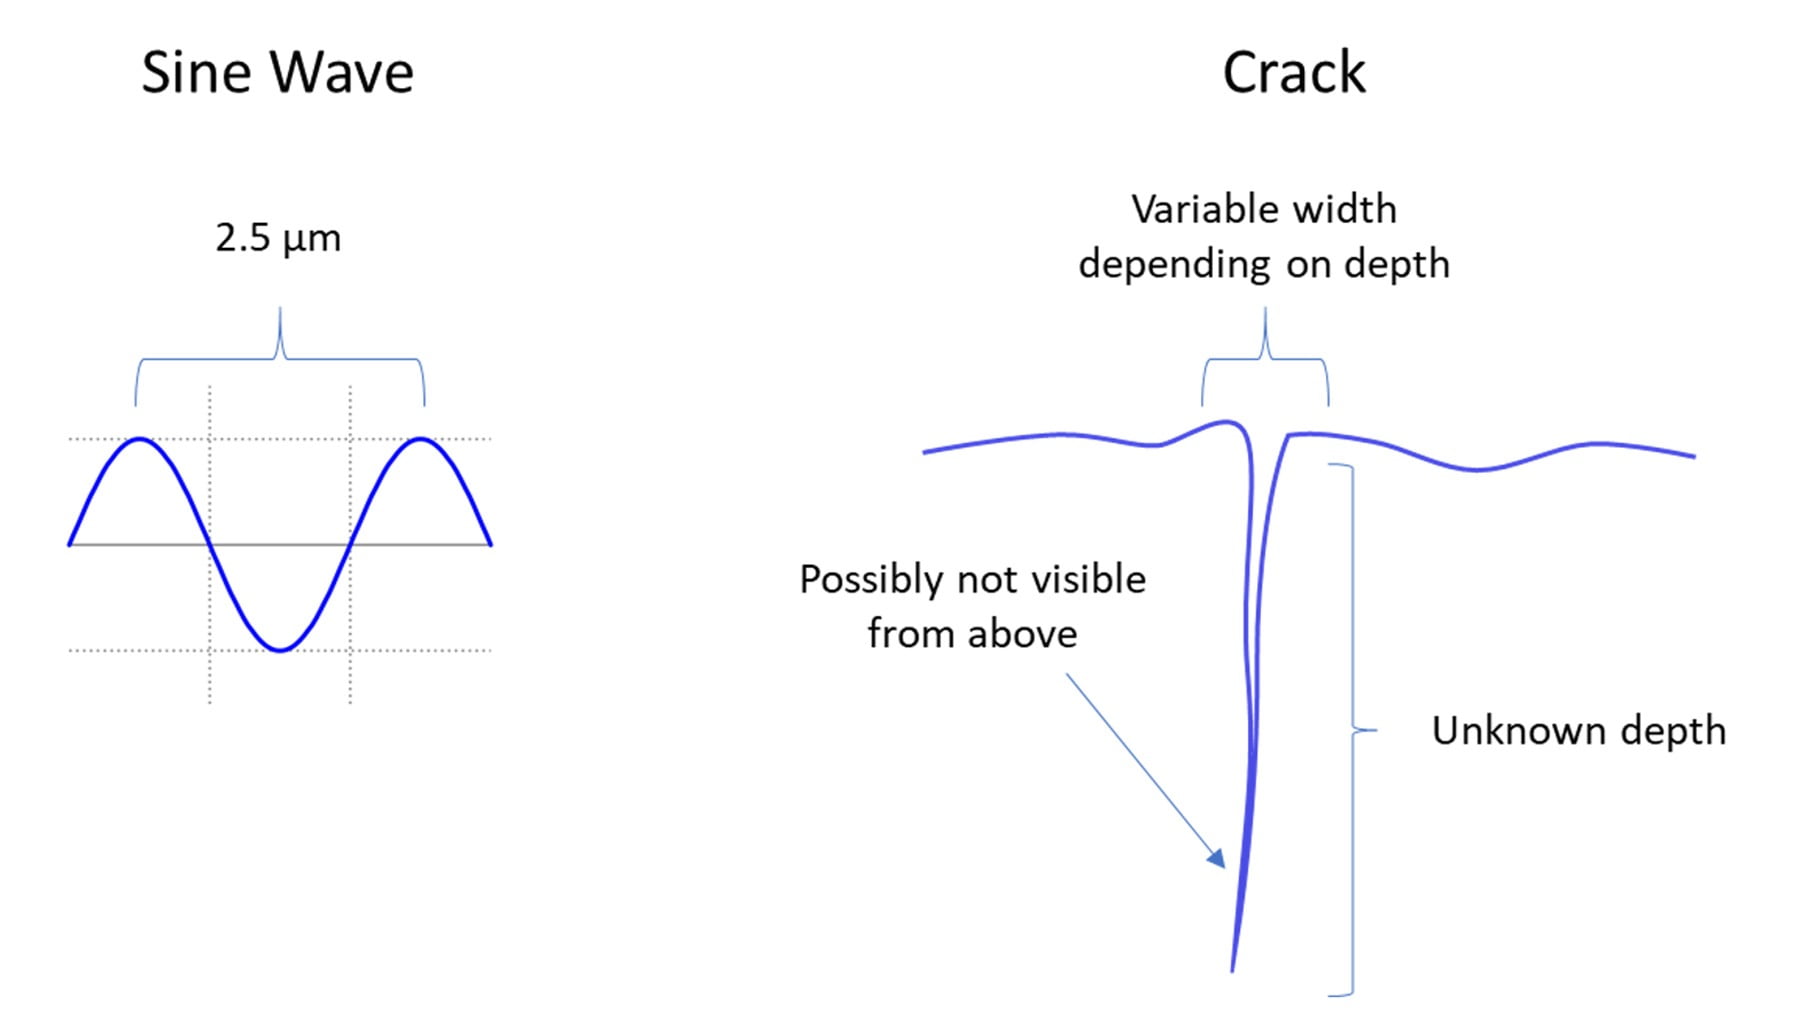
Figure 1. The short wavelength limit of surface texture and a depicted surface crack.
Figure 2 shows a graph of all possible wavelengths of surface texture. In typical, stylus or profile-based surface texture measurements, we suppress the shortest of these wavelengths to create what is called the “Primary Profile.” The Primary Profile represents the reliable limits of surface texture measurement. The application of the “short filter” defines a wavelength regime of interest that can help provide compatibility and comparability between measuring systems.
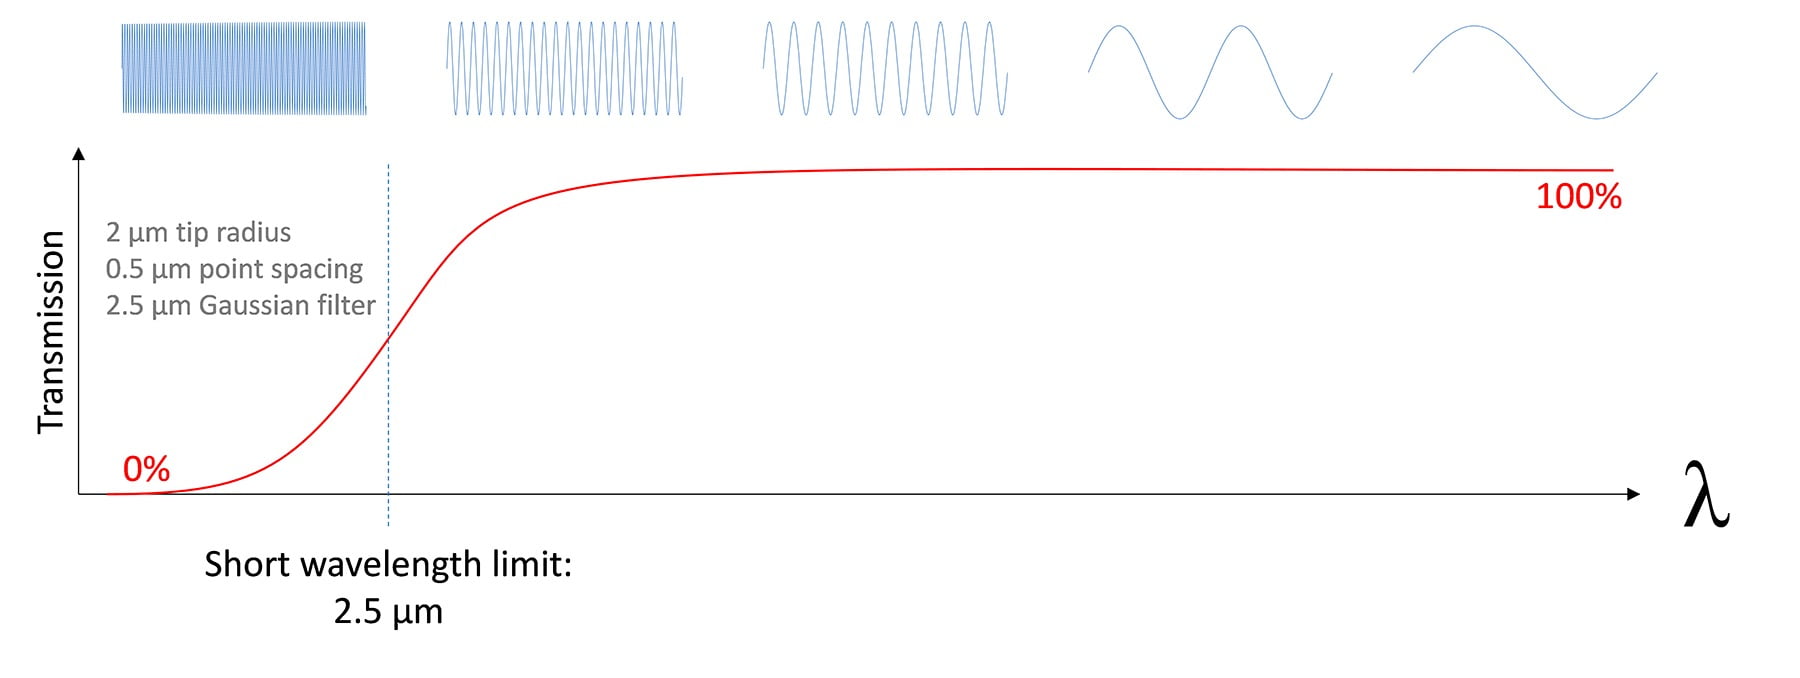
Figure 2. The wavelengths of surface texture, from shortest to longest.
Sensing wavelengths down to surface texture limits
The 2.5 micrometer short cutoff wavelength has a key advantage: it bounds measurements to the wavelengths that are large enough that many common measurement instruments can sense. To detect this full range of wavelengths with a profiling instrument, the stylus tip radius must be 2.0 micrometers or less, with data point spacing no greater than 0.5 micrometers. These requirements are reasonable for today’s stylus measurement instruments, and for many optical/areal surface measurement technologies as well.
For contact sensors the tip radius typically limits the lateral resolution, along with electronics, noise, etc. Optical sensors are typically limited by diffraction, pixel size, etc. Table 1 gives a comparison across a range of measurement technologies. It should be noted that for many systems (particularly optical systems), the smallest resolution can only be achieved when measuring with the smallest field of view and at the slowest scan speed.
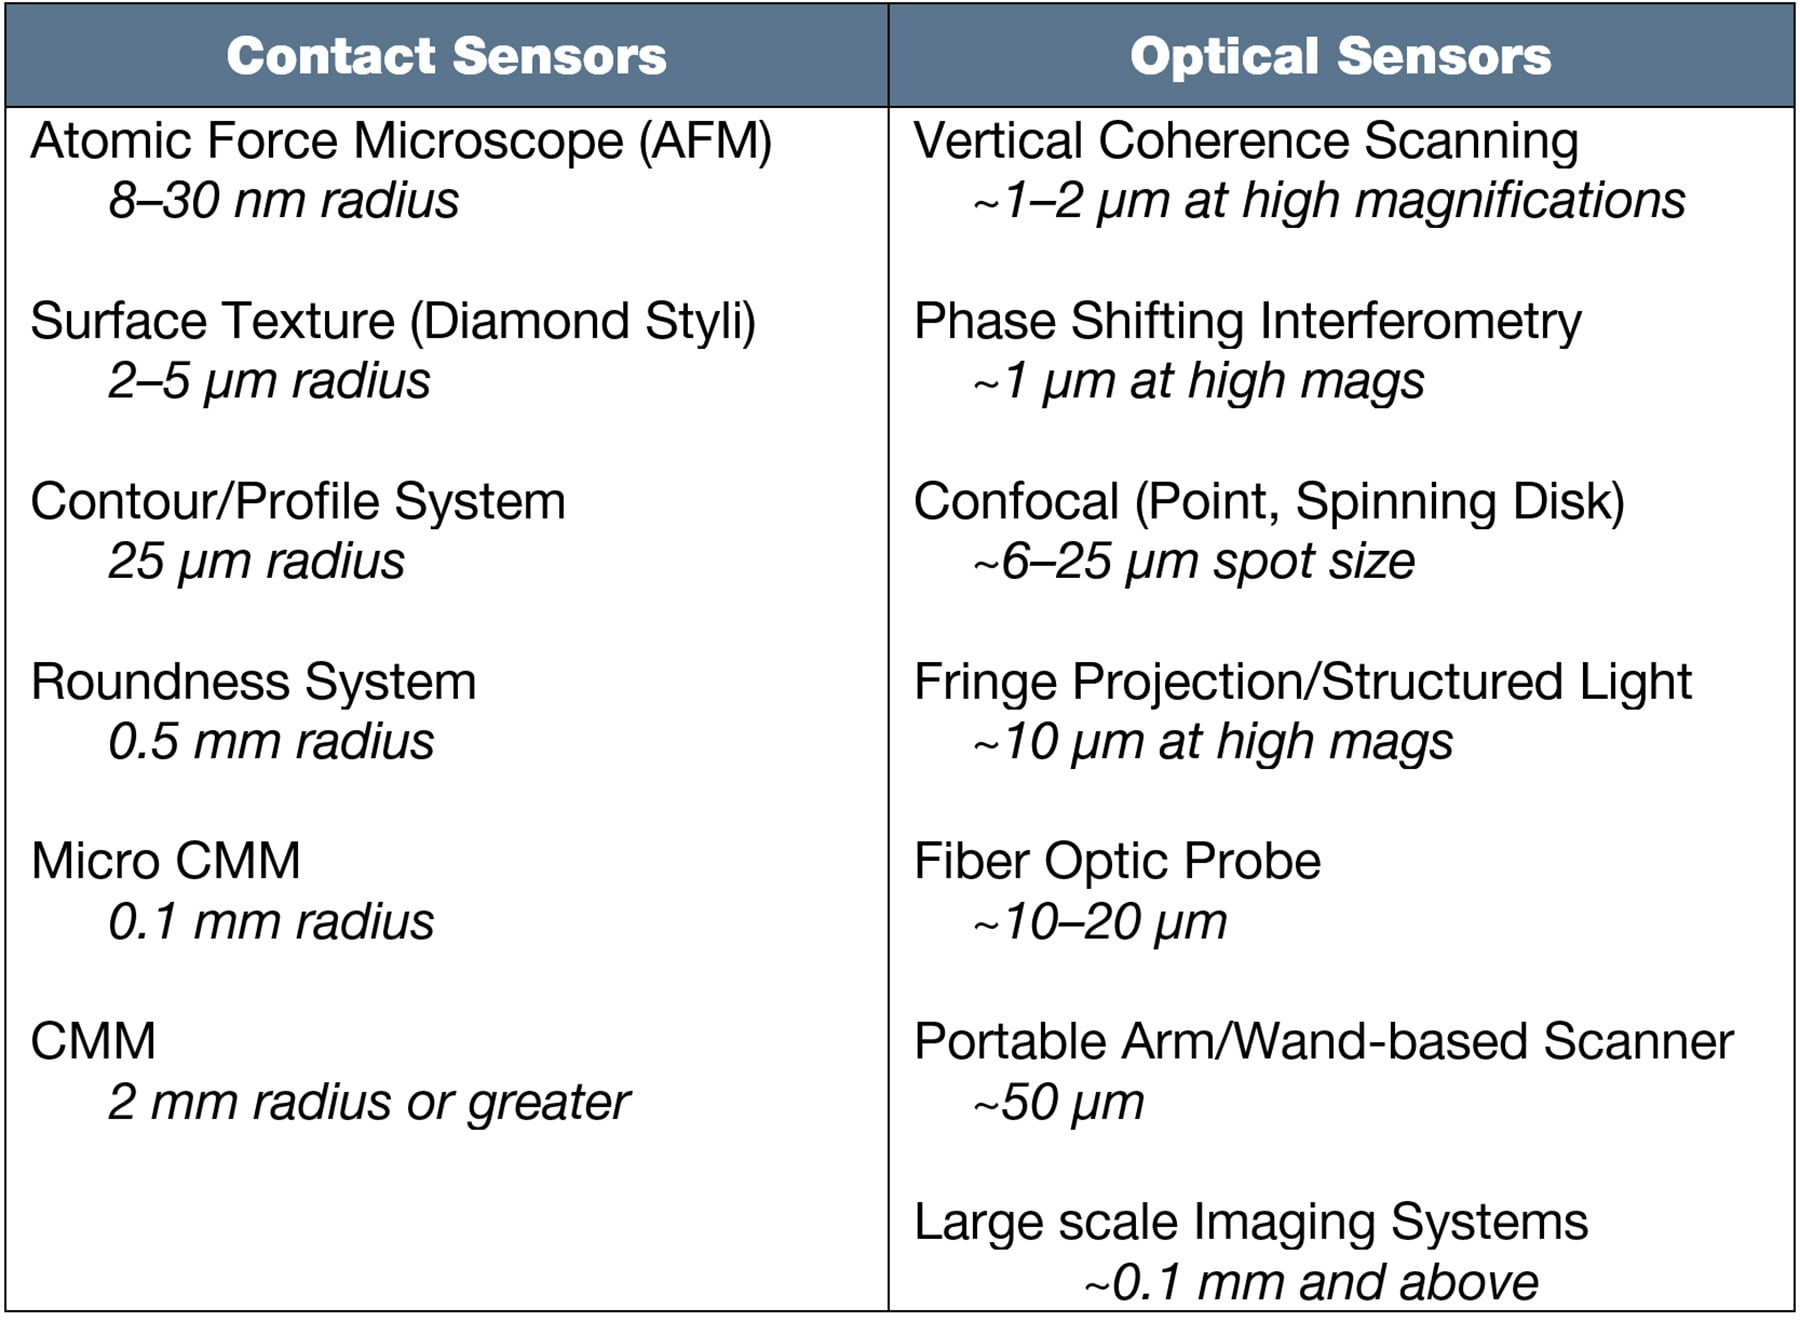
Table 1. Typical sensor limits as they relate to lateral resolution.
It should also be noted that many contact sensors can maintain the same density of data over any length of measurement. In other words, for many contact-based measurements, we can continue to add points when making longer traces. Most optical systems have a fixed camera size in pixels (for example 1024x1024 pixels). Thus, with most optical instruments, we measure larger areas by either choosing lower magnifications (less lateral resolution) or by stitching together multiple high-resolution images.
Data Density
Detecting narrow features requires closely spaced data points. Standards (such as ASME and ISO) indicate that at least 5 data points are required to adequately resolve the shape of a sine wave. If we consider the 2.5 µm wavelength from surface texture as our shortest wavelength of interest, we will require that the data point spacing be no greater than 0.5 µm.
This spacing, as it turns out, requires an enormous amount of data points to accomplish. Figure 3 provides a visual reference: the 0.5 µm spacing requirement would require nearly 1,000,000 data points on the tip of a 0.5 mm mechanical pencil refill.
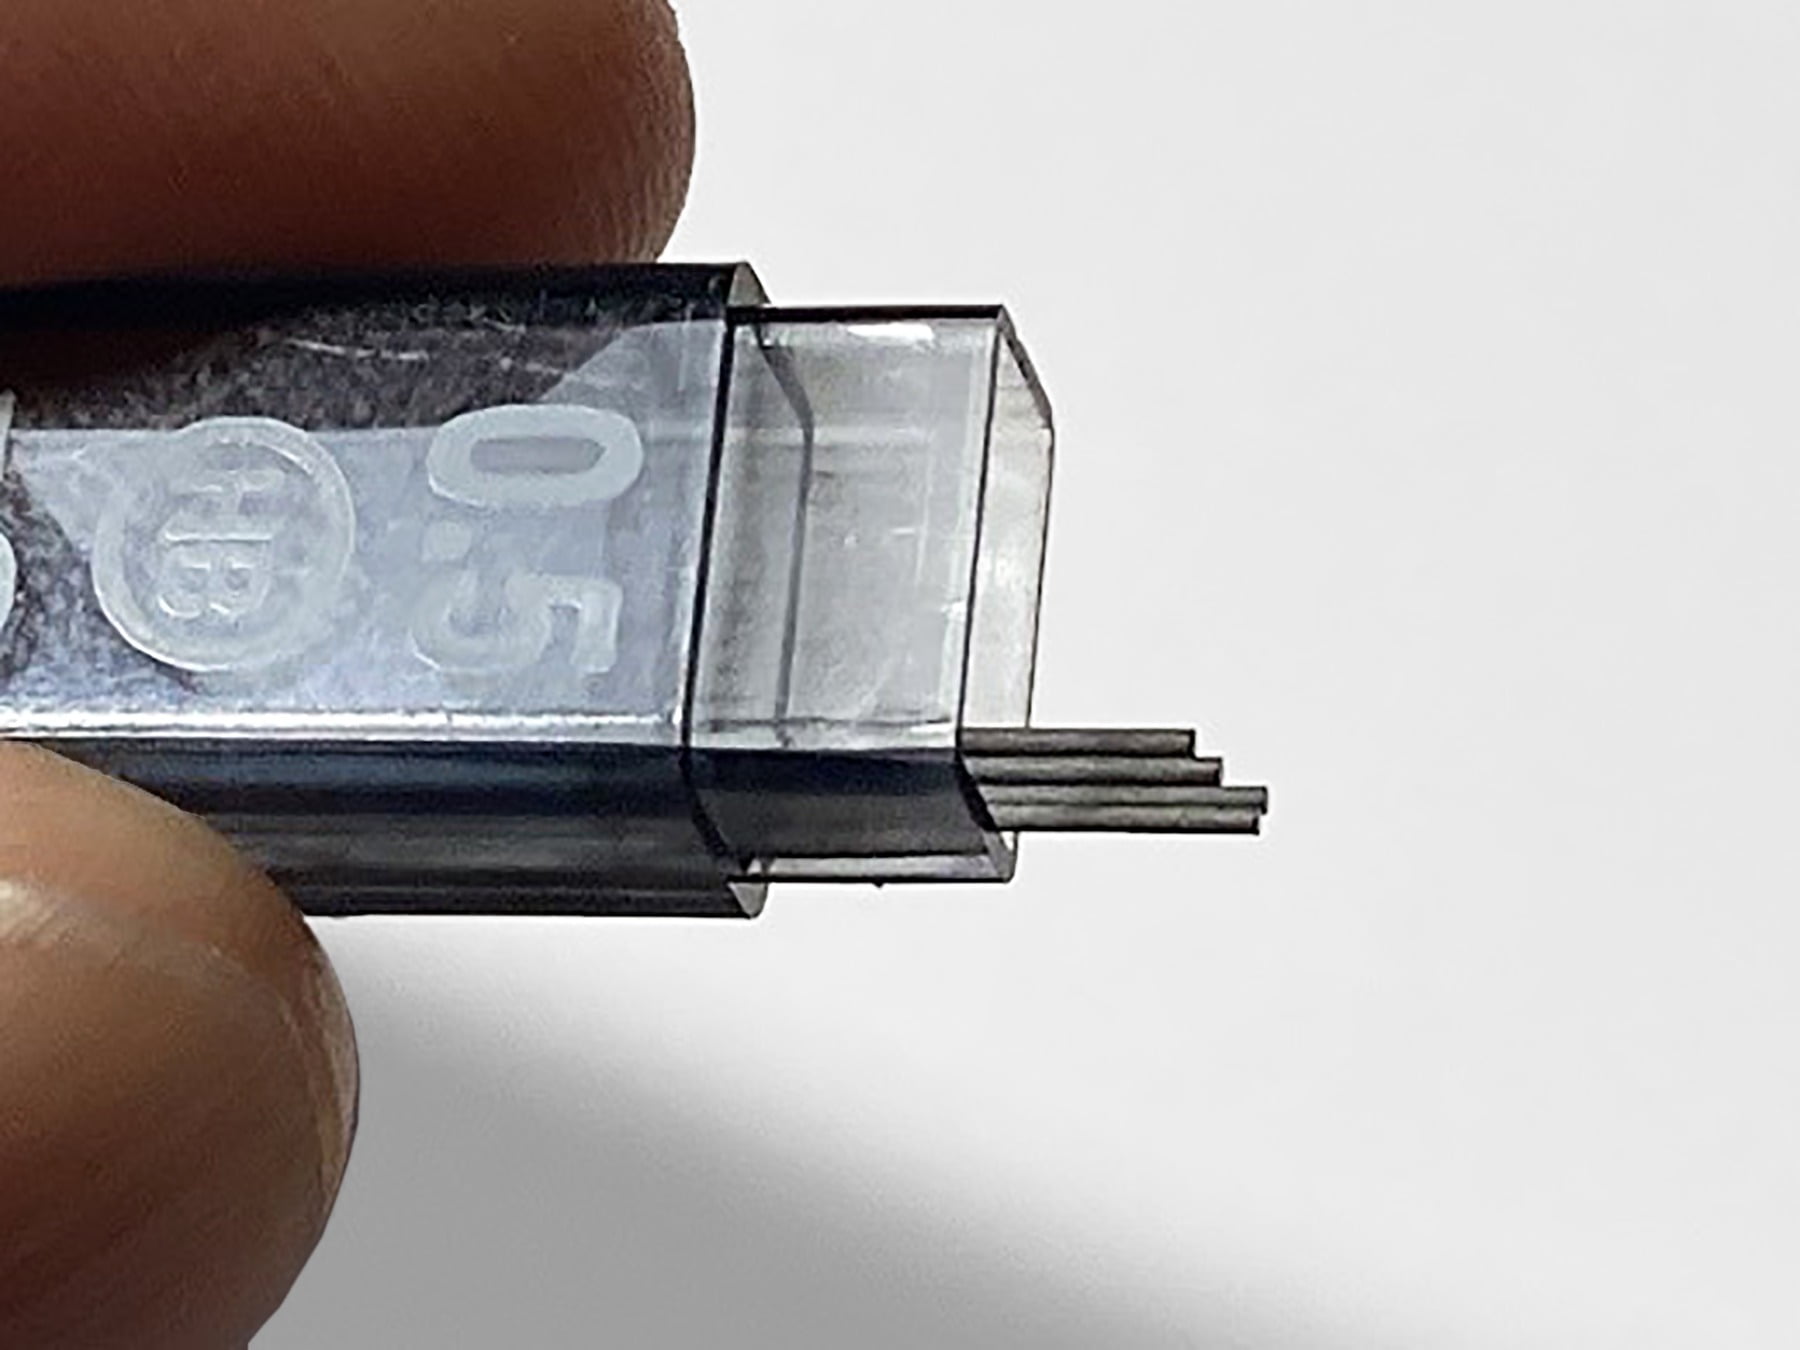
Figure 3. Measuring the surface texture of the tips of a mechanical pencil lead would require 1,000,000 points in order to achieve sufficient resolution.
The following sections address the specific requirements for some of the most common GD&T geometries.
Straightness: data points sampled along a line
The challenge with measuring straightness per rule “s” is in achieving a scan that is long enough to quantify the component, at the resolution needed to measure the surface texture. For small components it might be possible and practical to include wavelengths down to the 2.5 µm surface texture limit. For larger components, however, it becomes increasingly difficult. Table 2 gives a quick reference of the number of data points required to achieve the 0.5 µm spacing limit over various lengths of features.
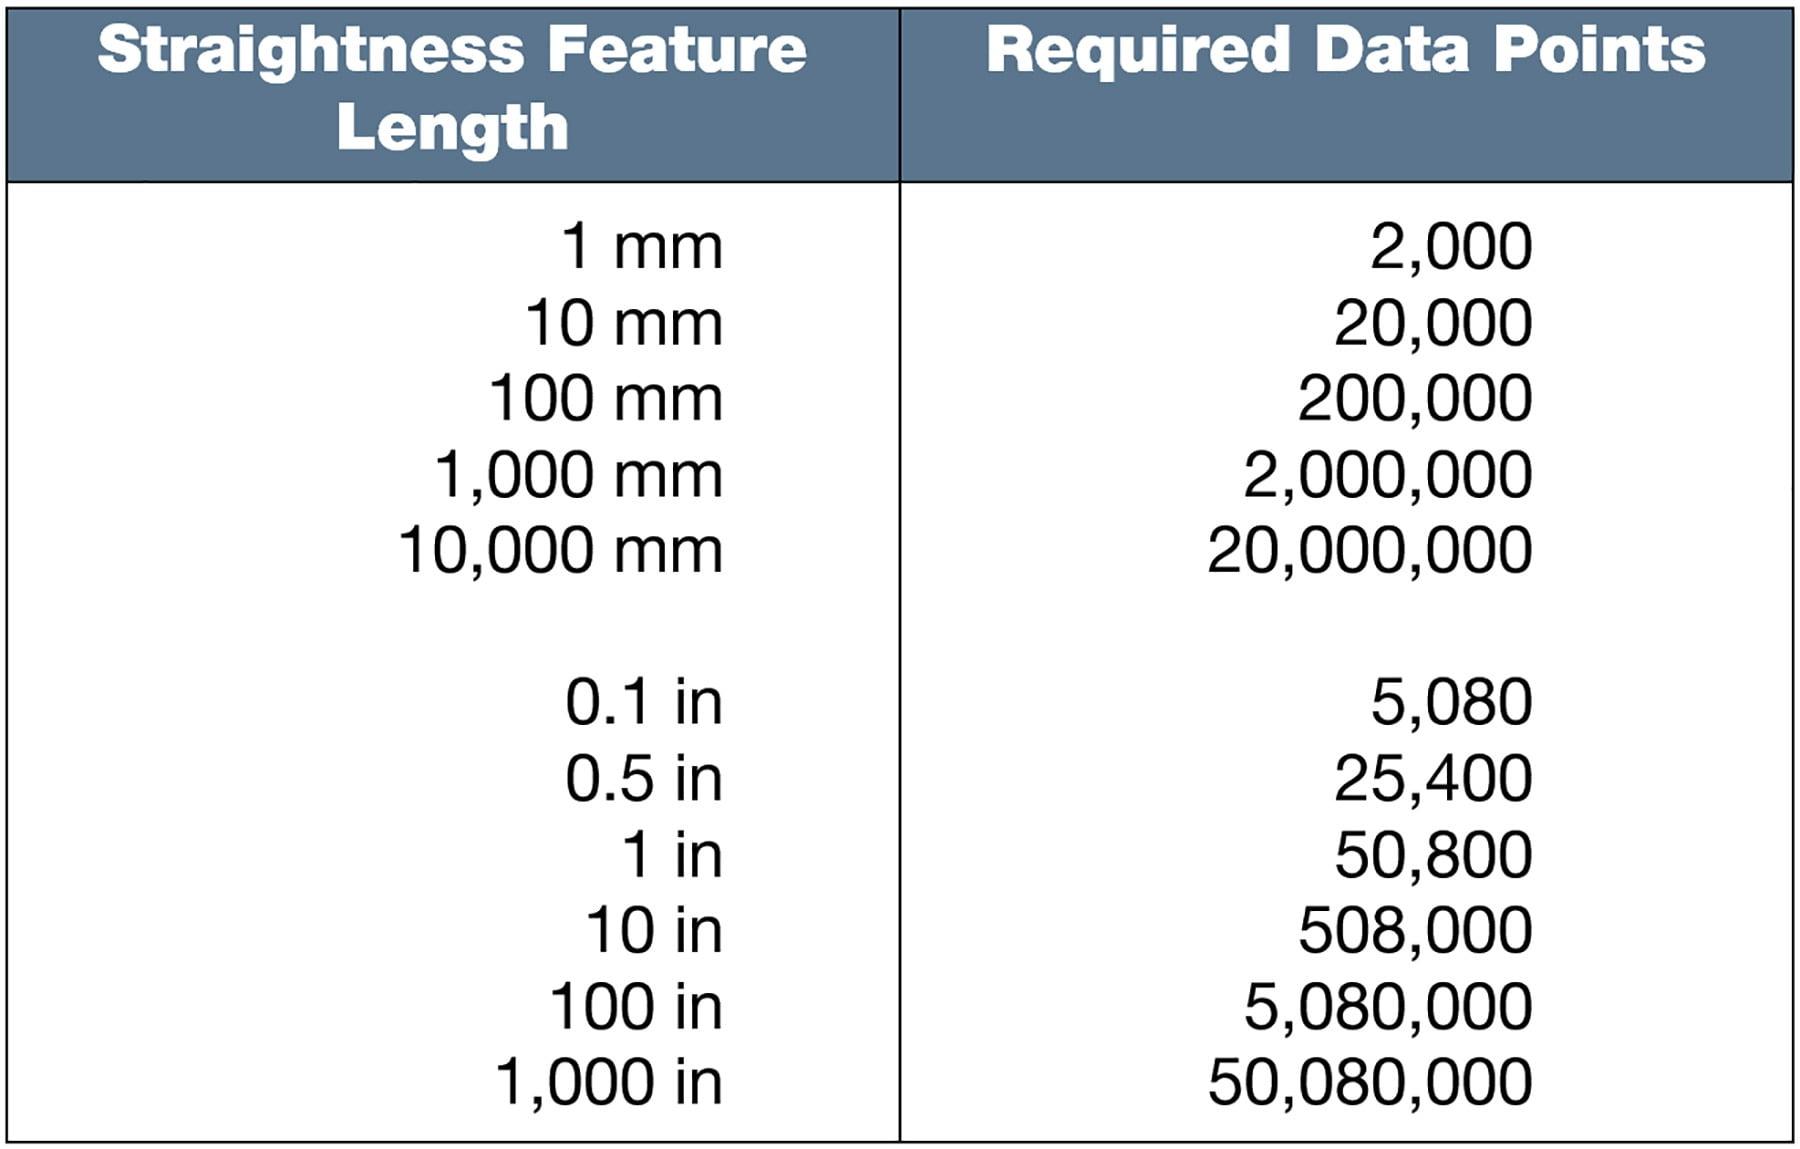
Table 2. Data points required to achieve a 2.5 µm short wavelength limit for straightness.
As Table 2 indicates, millions of data points would be required to measure the straightness of large structures (e.g., airplane wings). This is not practical in terms of data processing or measurement time and would not be well accepted in most industries.
Flatness: Data points sampled over a surface
As with straightness, the practical measurement of flatness requires managing the field of view (evaluation area) and the lateral resolution of the measuring system. Table 3 shows the required number of data points for various square areas.
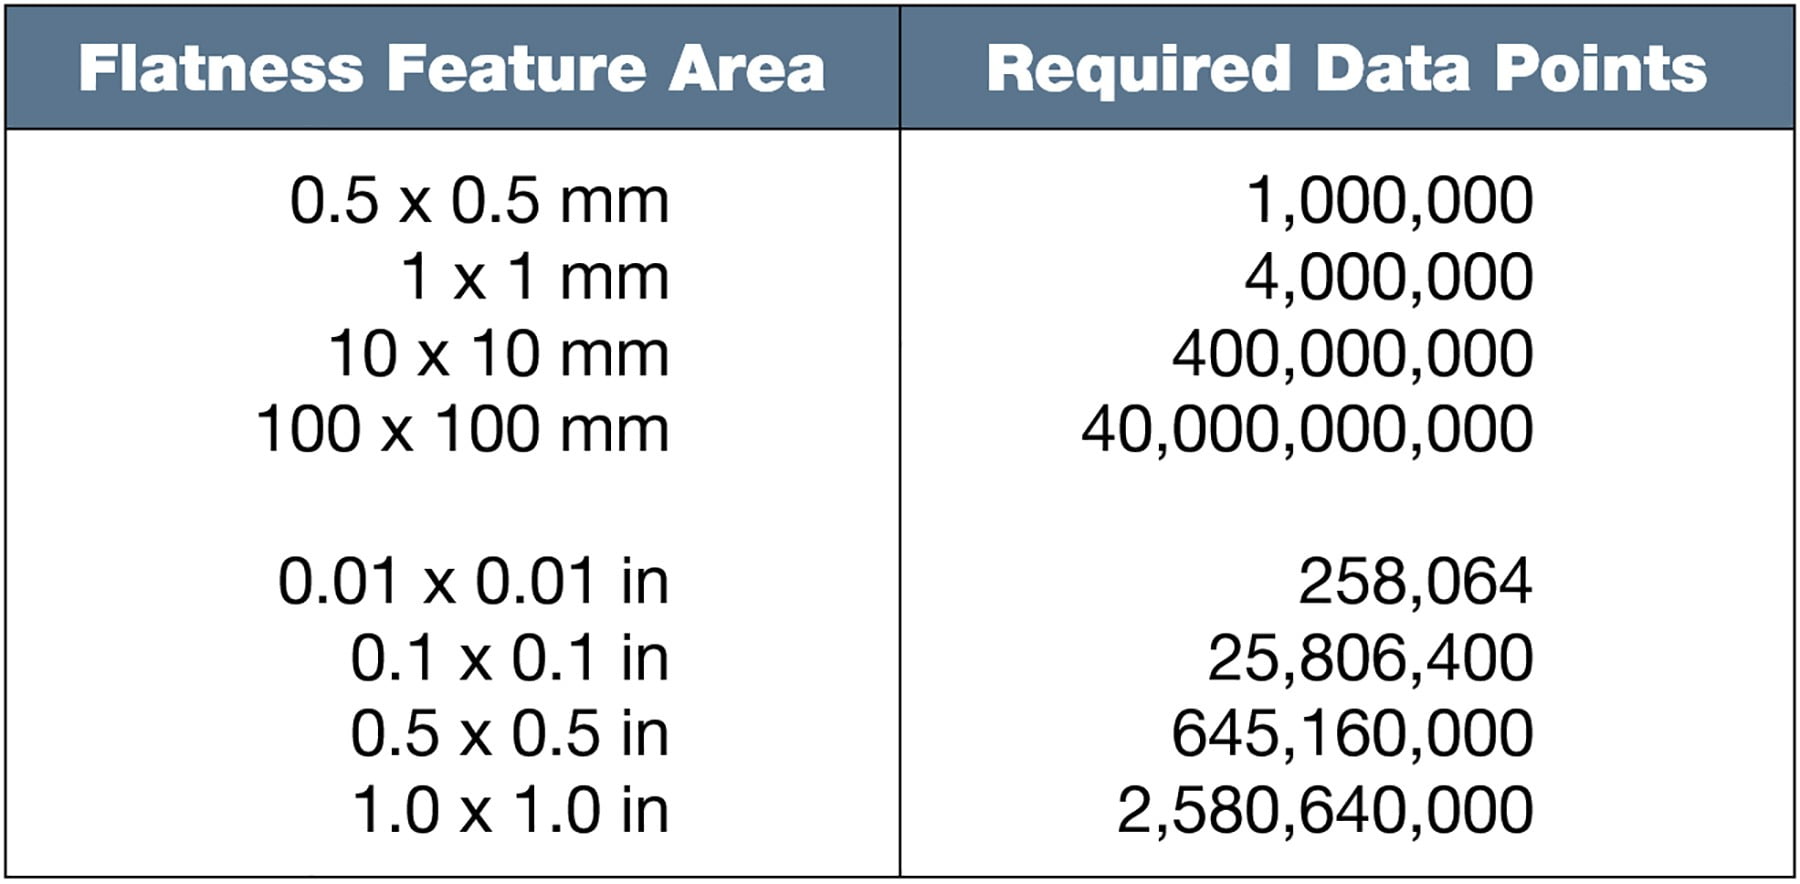
Table 3. Data points required to achieve a 2.5 µm short wavelength limit for flatness.
Per Table 3 we see that the more than 2 billion data points would be required for a flatness measurement on a simple 1” x 1” surface such as a gage block.
Measuring flatness at surface texture resolution is not practical for many workpieces as it requires huge data sets, long computing/processing times, and exceedingly long measurement times. For example, using a modern vertical scanning interferometer, the data acquisition for a 5mm x 5mm area requires more than 40 million points and can take approximately 20 minutes to complete.
Roundness: Data points sampled around a circumference
In practice, roundness measurement is based on analyzing a defined range of frequencies. Historically, “roundness” has been based on low frequency surface deviations up to a frequency limit of 50 “undulations per revolution” (UPR). That means low order features such as oval shapes and triangular shapes are included in roundness. However, if there are more than 50 equally spaced bumps (undulations), these high-frequency bumps would not traditionally be included as roundness.
ASME B89.3.1 has historically given the default filter cutoff of 50 UPR. However, Y14.5-2018 fundamental rule “s” is in direct conflict. Rule “s” would require an infinite filter cutoff—including all of the frequencies on the surface.
To better understand the impact of the 50 UPR filter, consider the fact that a U.S. quarter has 119 serrations. As Figure 4 shows, the 50 UPR roundness filter (per ASME B89.3.1) suppresses much of the high frequency information related to the serrations and reports only the underlying “shape.”
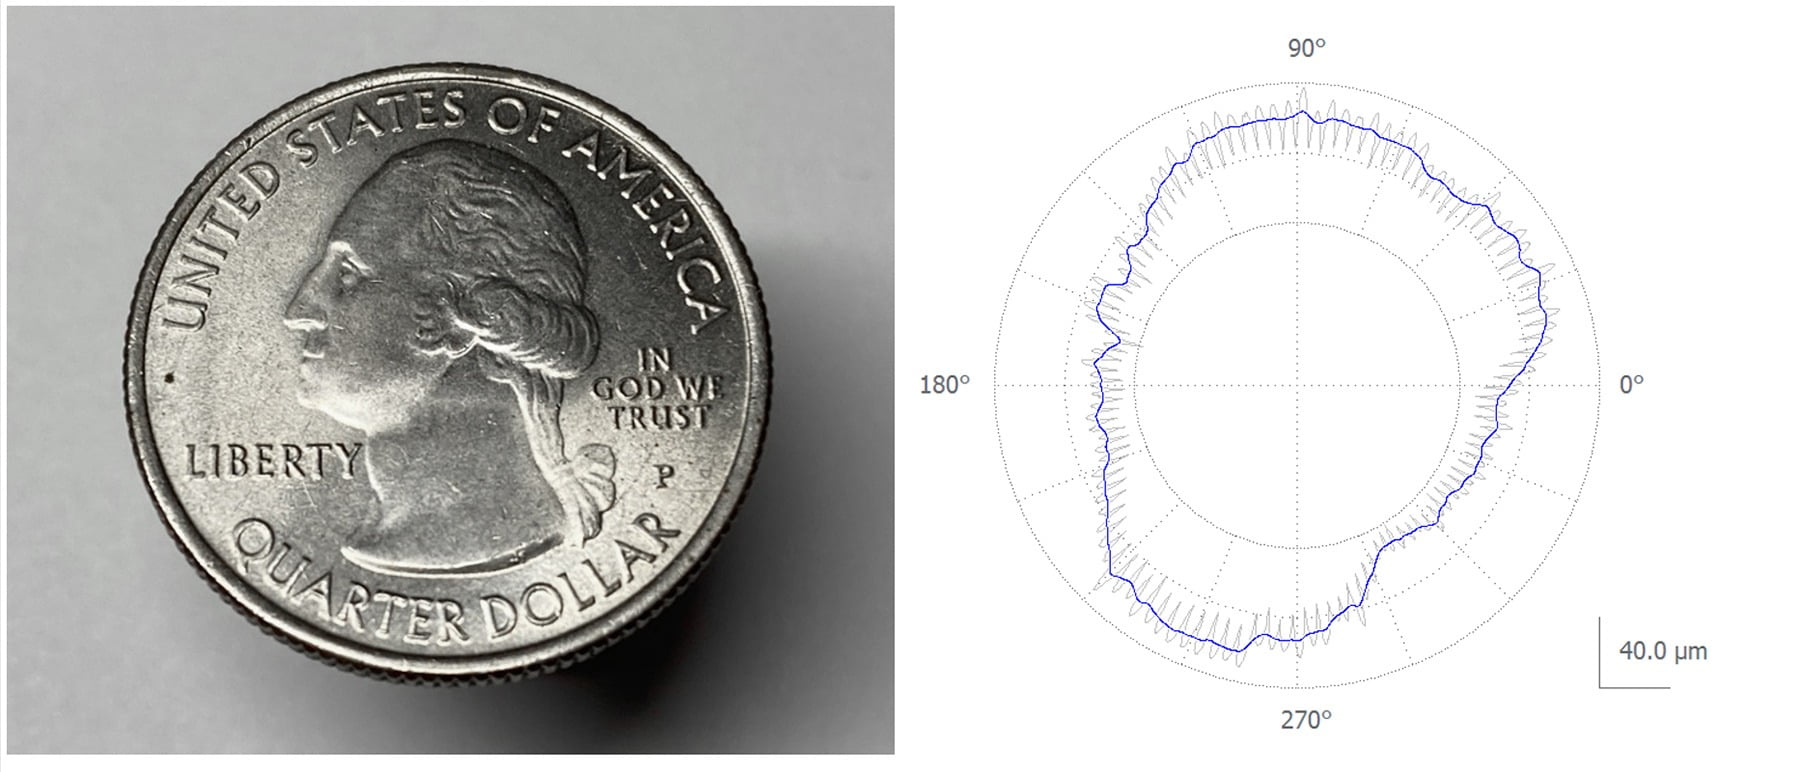
Figure 4. The 50 UPR filter (shown in blue) suppresses the serrations of a quarter.
In Figure 4 above, we see that the default, 50 UPR roundness filter smooths out the quarter’s serrations (gray) and reports only the underlying shape (blue). In many industries this is preferred as the serrations may be controlled separately from the underlying shape.
In the context of Y14.5-2018 rule “s,” however, roundness should be treated the same as any other GD&T feature. Thus, according to rule “s,” roundness should include all surface features. If we conclude that roundness features should include fine details down to the surface texture limit of 2.5 µm wavelengths, we need to consider the circumference of the roundness feature. As the diameter increases, the number of required data points will also increase as shown in Table 4. Again, it can be concluded that larger circumferences, which are very common in industry, will lead to unbearably large data sets.
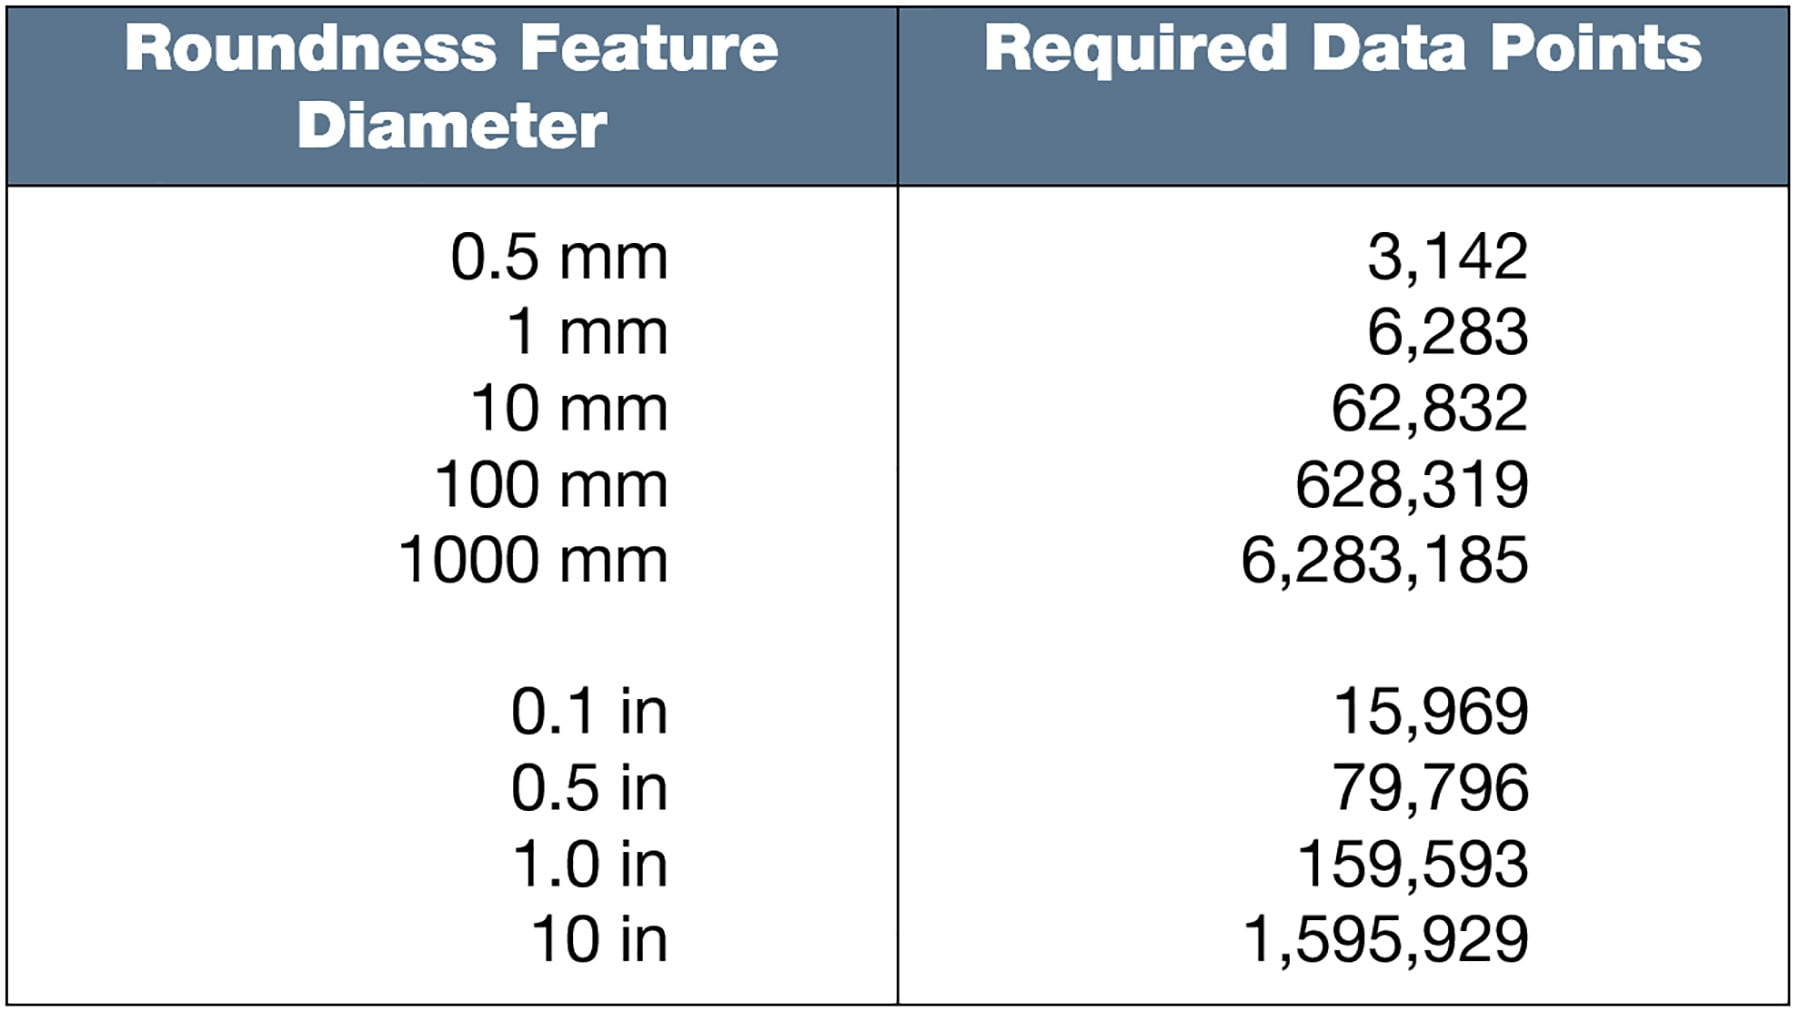
Table 4. Data points required to achieve a 2.5 µm short wavelength limit for roundness.
Recently, several instrument manufacturers have begun introducing roughness-measuring styli into their roundness systems. However, there are limits with this approach. For example, many of these systems are using 5 micrometer tips instead of 2 micrometer tips, due to the need for higher contact forces in these systems. Thus, while these systems have significantly improved lateral resolution, they are still not quite as good as traditional roughness measuring instruments. Furthermore, these systems cannot handle large workpieces due to the physical constraints of the instruments themselves.
Cylindricity: Data points sampled over a cylinder (distributed axially and radially)
Cylindricity poses a unique metrology sampling and filtering challenge due the fact that the axial direction is based on a linear control with linear sampling, filtering, and processing. At the same time, the circumferential direction is based on an angular control with angular (or frequency) based sampling, filtering, and processing.
Historically, cylindricity data has been acquired via various profile-based methods:
Circular slices
Circular slices with axial profiles (gridded or “birdcage” data)
Spiral paths
In more recent years, “full surface” cylindrical data sets are being produced, but these are still relatively rare and are generally made up of a comparatively low number of data points. These approaches rely heavily on widely spaced sampling and a great deal of interpolation/smoothing to generate the appearance of a full surface. The interpolation and smoothing that is involved in this practice results in a loss of the finer details of the surface and therefore is not directly compatible with note “s.”
To better grasp the number of data points that are required to assess cylindricity on a surface, including those defined in surface texture, consider the common AA battery in Figure 5.
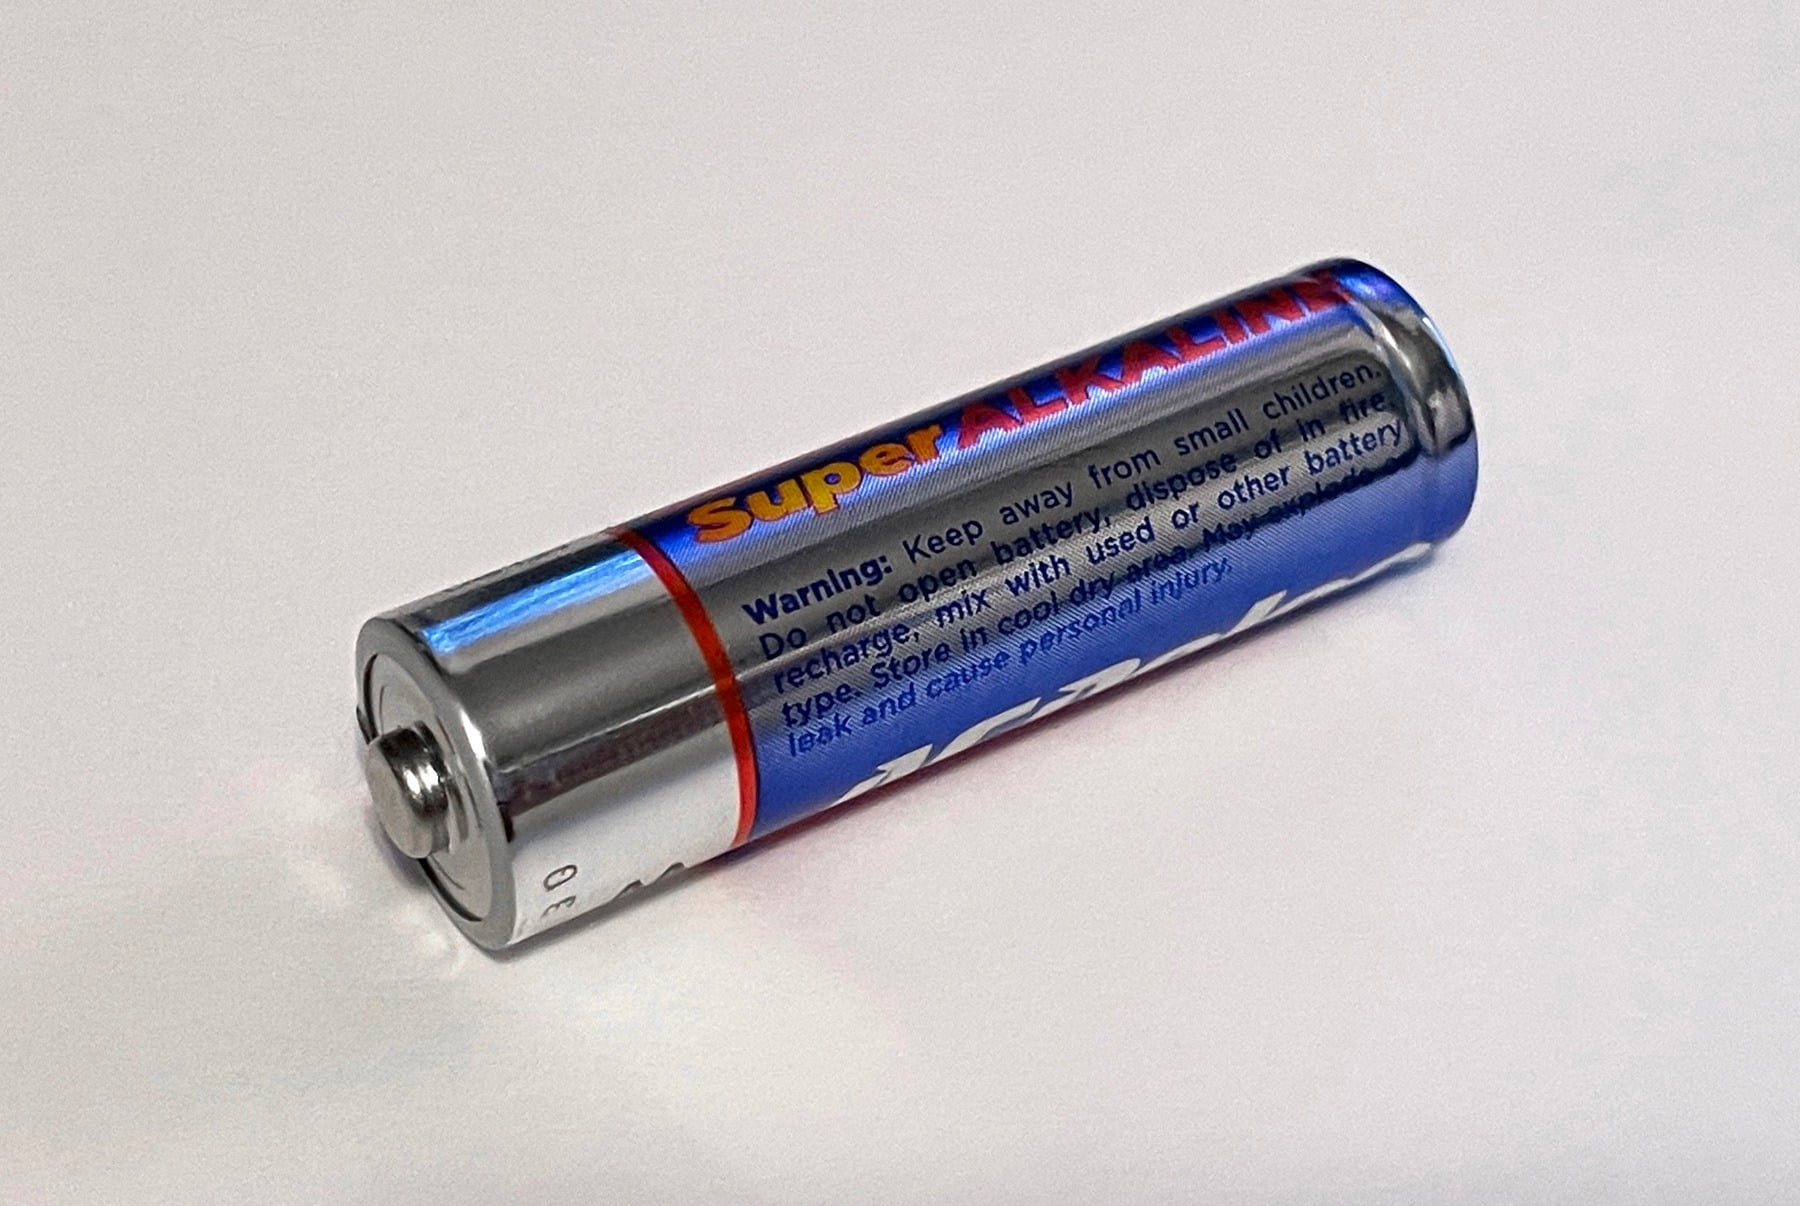
Figure 5. If surface texture is included in the cylindricity evaluation of this AA battery, the measurement would require more than 2,800,000,000 data points.
As we consider the cylindricity of a feature the size of a AA battery, the number of data points isn’t the only consideration: we must also consider the time it would take to acquire the data. For example, the acquisition of those nearly three billion points would require approximately 15 hours using a common interferometric microscope.
For a simple cylinder with a length-to-diameter ratio of 2:1, Table 5 shows how the data sets become very large, for even relatively small components.
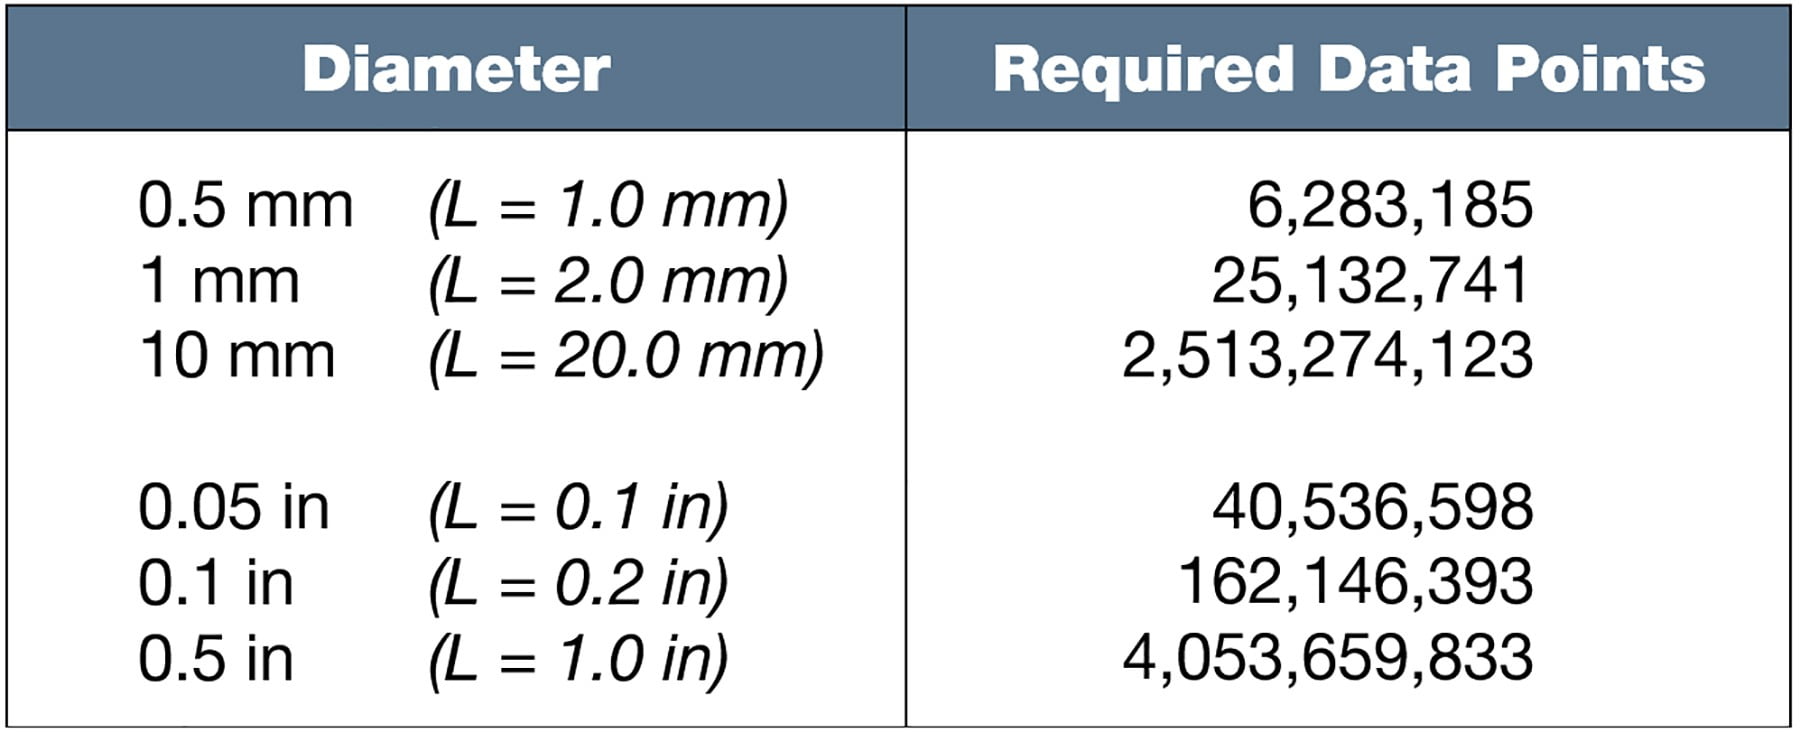
Table 5. Data points required to achieve a 2.5 µm lower wavelength limit for cylindricity (assuming an L:D ratio of 2:1)
Conclusion
The above discussion outlines the challenges, and in some cases, impossibilities, of measuring some common GD&T features in accordance with ASME Y14.5-2018 Fundamental Rule “s.”
In the approach considered above we limited the wavelengths for GD&T measurements to those typically included in surface texture. This provides a common range of interest that can be compared across instruments; however, it excludes the narrowest features and flaws, such as cracks. Though sensors are available that can measure these wavelengths, the data sets become unmanageably large (billions of data points) for relatively small components. In addition, the time required to sample surfaces at this high density is not practical.
Companies considering how to comply with this fundamental rule will need to come to terms with the practical balance between measurement range, resolution, and time. Some industries (for example, the optics industry) often opt for an approach in which long wavelength “form” is separated from shorter wavelength “texture,” and texture is separated from flaws and defects. These industries and companies are taking advantage of the “unless otherwise specified” clause. This approach can be particularly useful as it decomposes a single geometry (for example, flatness) into components that may be more connected to specific functionalities and specific process controls.
No matter the approach that is selected, it is imperative that these conversations take place between product development/design and the manufacturing and quality organizations and ultimately, the customer, so that everyone fully understands the meaning and implications of measurement results as they relate to the drawing requirements.
For additional reading:
Mennuti, Attilio (AJ). Industry Implications of ASME Y14.5-2018 Note S and the “Nested” Principle, Master’s Thesis, UNC Charlotte, 2020
Malburg, Mark. Flatness in the USA, digitalmetrology.com/flatness-in-the-usa/
Source for all images: Digital Metrology Solutions
Dr. Mark Malburg is the president of Digital Metrology Solutions. With over 30 years in surface metrology, he is the chief architect of a range of standard and custom software for surface texture and shape analysis. Dr. Malburg has consulted in numerous industries from optics to automotive and aerospace. He is active in ASME and ISO standards committees and has helped shape many of the standards that govern surface specification, measurement and control.
AJ Mennuti is a metrology engineer at Cummins Inc., with over 5 years of experience in GD&T and dimensional metrology. His graduate research was focused on the implications of the Y14.5 rule “s” throughout industry. Currently he is focusing on large scale metrology and updating corporate standards so that they remain relevant in the next generation. Mennuti graduated with a master’s degree in metrology engineering from UNC Charlotte in May 2020.
Mike Zecchino has been creating technical content and resources related to metrology and measurement for over 20 years. His articles have appeared in dozens of publications, and his training materials and videos support numerous measurement instruments and technologies.
May 2021 | Volume 60 | Number 5