NDT in Aerospace
Inspection
AEROSPACE
By Philip Sperling
CT-Scan Data Analysis
and Visualization for Aerospace NDT
For as long as there has been commercial and military flight, aircraft component suppliers have been charged with providing dimensional and process control-related data.
As the use of advanced materials and manufacturing methods in aerospace and defense continues to evolve, CT scanning is increasingly proving its worth as the ultimate in nondestructive testing, particularly for the most valuable parts and components. Whether it’s a reinforced composite helicopter blade, a machined titanium rocket nozzle, a 3D-printed aircraft heat exchanger with complex internal channels, or a lithium-ion battery powering essential electronics, proving out the integrity of the piece nondestructively has many advantages.
Industrial CT can penetrate almost every material, from plastics to composites to superalloys, revealing hidden details that previously could only be found by cutting and destroying finished parts. However, especially when scanning is performed after manufacturing, CT-image inspection alone without further analysis can lead to over- or under-estimation of the significance of visible anomalies. This can lead to high rejection rates, time-consuming corrective measures, or excess weight being added to designs in compensation—all negatives in expensive aerospace projects.

Aerospace takes an early lead on the use of CT data
The idea of using CT to peer deep inside critical parts—and analyze the resulting data—first surfaced as far back as the 1990s. Perhaps not surprisingly, physics-department engineers at Boeing were among the early enthusiasts for its use to assess aerospace-part quality. In a chapter for the 1991 Review of Progress in Quantitative Nondestructive Evaluation, they wrote about “a new inspection capability for aircraft hardware.”
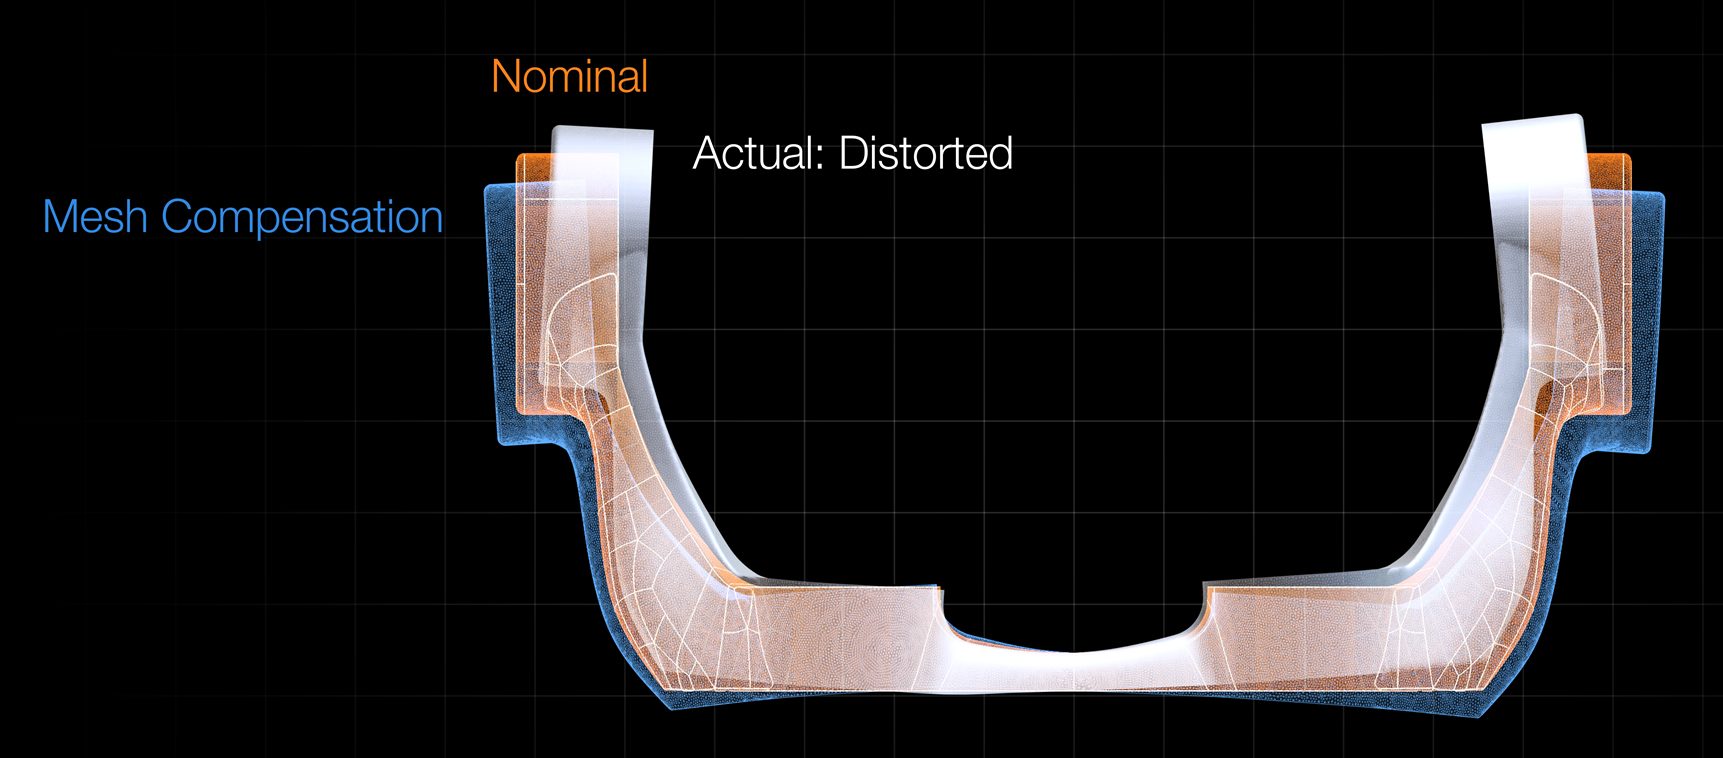
Mesh compensation on an additively manufactured bracket made of metal. This generates a compensated model of the part from the original model and a CT scan of the warped or distorted part, enabling faster and fewer iterations to achieve final part geometry. Image courtesy Volume Graphics
“We believe that the most beneficial application of CT will be in using CT data for component acceptance by engineering criteria rather than inspection standards,” noted the authors. They were clearly anticipating that the value of scan images could extend beyond the limits of human vision. Rather, it could be the scan data itself that could be captured and queried to reveal predictions about component performance far beyond structural integrity alone.
At that time, the more sophisticated analysis tools that would be needed to take full advantage of scan data were in the early stages of development. The authors described CT scanning of an aircraft drum casting that revealed a defect in the outside wall. To predict the potential impact such a defect might have on the component’s performance, the scan data was converted to a 2D digital model of the part and then transferred to a finite element analysis (FEA) code. FEA was a nascent tool at the time, not yet widely used; while the effect on performance was predicted quite accurately, the analysis itself involved expert setup and long run times and the images were low in resolution.
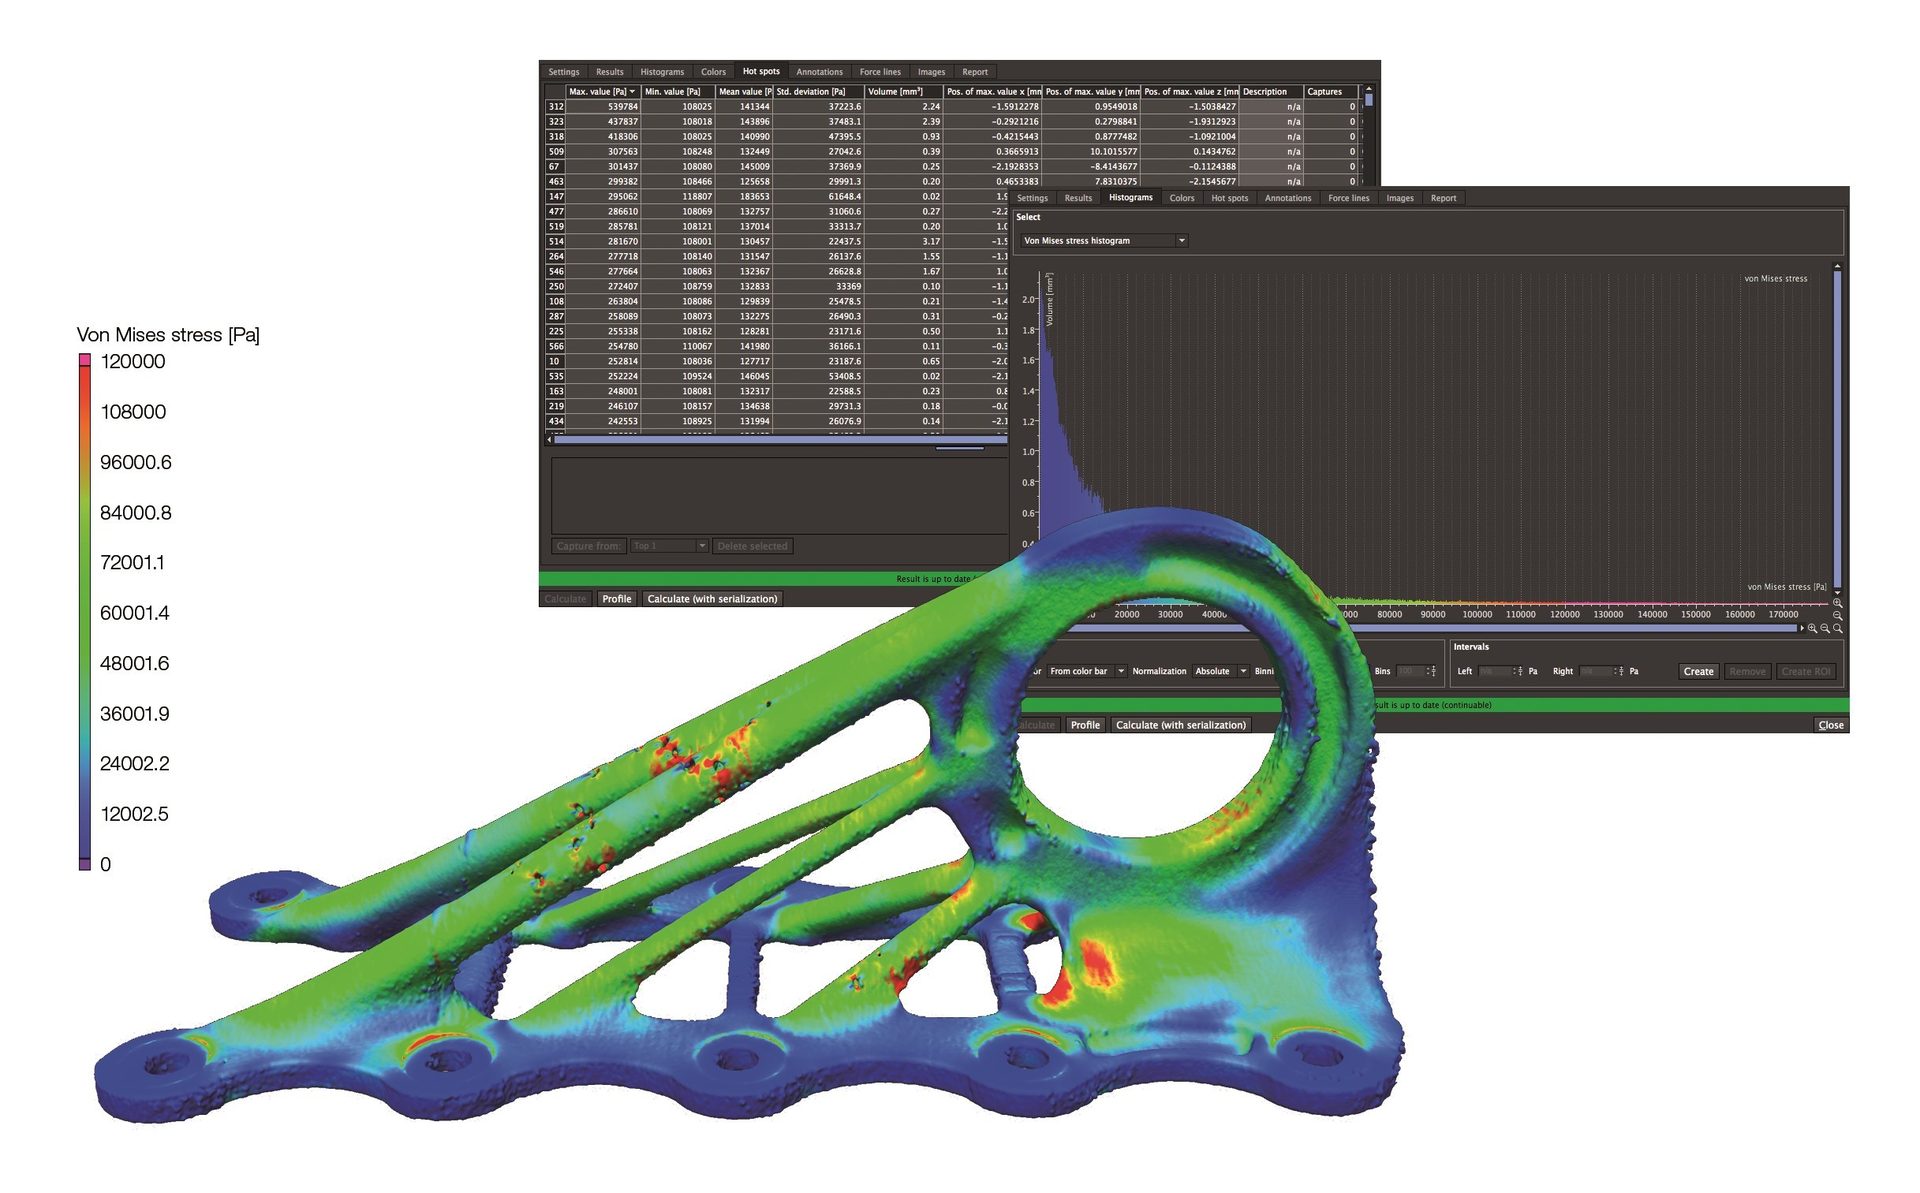
Data from a CT scan of a topology optimized aerospace bracket, additively manufactured from an AlSi10Mg aluminum alloy, with visualized results of a structural mechanical simulation directly on the CT data inside VGSTUDIO MAX. Image courtesy Airbus and Volume Graphics
By 1997, however, German physicists had created the first digital tools able to directly process CT slice-image stacks on standard PC hardware. A year later, the application did away with the need to analyze data slice-by-slice, covering volume in all three dimensions.
Flash forward to today, where CT-data analysis and visualization software is now a multi-use tool with a broad variety of applications of particular interest to aerospace. The software uses CT-scan data to recreate a three-dimensional volume of a part containing complete, detailed information about its geometry, both surface and interior. This in turn can be compared against the part’s master model and analyzed for a wide variety of performance and durability metrics that, recorded and categorized, can be used to support qualification and flight certification. While still commonly performed after manufacturing, the technology is increasingly appearing in-line, on the production floor.
Digital volume correlation for an additively manufactured gyroid lattice made of metal in two different states: compressed and uncompressed. This picture shows the displacement lines and enables a better spatial impression of the deformation mechanics of this structure. Image courtesy Volume Graphics.
Understanding both the geometry and the physics of a part
Today’s advanced industrial CT machines produce extremely high-resolution (generally between 1 and 400 microns), data-rich images. Advanced CT-scan analysis software transforms this data directly from the CT file to a digital 3D image (i.e., as three-dimensional voxels, rather than 2D pixels). The software has various functionalities that highlight internal and external geometries, detect voids and inclusions, analyze fiber orientation and fiber volume, confirm densities, and perform high-accuracy metrology for first-article dimensional inspection (such as for AS9102). Measurement templates present data, such as the geometry of every individual void detected in a part, in formats that can be included in the product manufacturing information (PMI) database for the product.
Also integrated within the software is finite element analysis (FEA) functionality empowered by high-performance computing, automated “meshless” solver algorithms and sophisticated multiphysics capabilities. This functionality predicts part stability, strength, and performance with accuracy, speed and ease-of-use that have become transformative for those aerospace manufacturers who’ve adopted it.
An integrated CT-data-analysis software package reproduces the exact geometry and behavior of an individual part or component (from a single bracket to a full engine block) no matter how it was made—or what it’s made of. Whether it’s a casting, a composite layup, or additively manufactured (AM) using aluminum, titanium, Inconel, carbon fiber or ceramic composites, the x-ray source and detector of the CT system can be adjusted to penetrate almost every material, and the analysis software be put to work on the resulting data.
Fiber composite material analysis in CT data analysis and visualization software was used to analyze the fiber orientation within helicopter rotor blades made of light-weight, fiber-reinforced plastic composites. Image courtesy Volume Graphics
In every case, deviation from the part’s master CAD model, as well as failure potential under a wide range of multiphysics conditions, can be automatically identified. This helps manufacturers evaluate whether defects are above or below tolerance criteria, and supports critical go/no-go decisions that can have significant economic impact. What’s more, quick feedback on as-manufactured parts can inform design decisions, guide adjustments to mold dimensions, and help direct changes to manufacturing equipment settings that will optimize the final product.
First articles of injection-molded parts, as well as 3D-printed parts, are often not only out of tolerance, but can be warped in such a way that a measurement plan created on the nominal CAD object cannot be applied to the scanned part. The latest versions of analysis software now include adaptive measurement templates that follow the shape of distorted parts. With these templates, a measurement plan can be created using the nominal CAD data or it can be imported via PMI. The measurement points are placed at the optimal positions on the actual part and follow the distorted shape.
Let’s take a deeper look at two production methodologies that are of particular interest in current aerospace disciplines, additive manufacturing (AM, aka 3D printing) and advanced composite manufacturing. These technologies are seeing growing acceptance in everything from commercial aircraft to space rockets to drones.
CT scanning additively manufactured parts
Major commercial aircraft manufacturers have been exploring additive manufacturing for some time (Airbus was an early adopter, changing conventionally manufactured metal brackets to topology optimized, AM ones). Bolder moves are being made by unmanned-flight innovators who are 3D printing end-use parts made from high-performance materials and superalloys like Aluminum F357, Inconel 625, and Hastelloy-X. “Impossible” designs for microturbines, heat exchangers and other components—with intricate interior channels, thin walls, and zero-degree blade angles that can’t be manufactured via any other manufacturing technology—are now possible with AM.
Extreme temperature tolerances, part consolidation (60 parts down to one is not unusual), lightweighting and efficiency enhancements—all these benefits that AM can bring to aerospace must still prove their worth through real-world inspection, tests and trials. This is where CT-scan data analysis is providing value in many ways.
CT scanning allows additive manufacturers to verify that their equipment is functioning properly and their processes are both sound and repeatable. Porosity, lack of fusion, cracks and voids—these and other defects are clearly visible, as are internal part features that would otherwise require cross-sectioning and other destructive methods to qualify.
For aerospace-grade metal parts production, laser powder bed fusion (LPBF) processes are most commonly employed. These technologies are also the most expensive when it comes to equipment. And due to LPBF’s relatively low build speeds and high material costs, it is not cost-effective for a manufacturer to print multiple iterations of a full-size workpiece and CT scan each one until the perfect process setup has been determined.
Instead, manufacturers begin developing their production operating parameters by printing small test cubes at various locations and orientations within the build chamber. These are then CT scanned for attributes like material density and consistency, and separation between layers. If defects are found, the operator will adjust laser power and other variables, printing multiple test specimens until an optimized balance of productivity and part quality has been achieved.
This process is then repeated with larger parts, and those with complex geometries representative of the target workpiece. Design elements like cooling channels, overhangs, and various wall thicknesses can also be repeatedly evaluated.
CT scanning has shown to be an important tool for the qualification of these and future materials. This is true not only for the 3D printed brackets, fuel nozzles and turbine components made from them, but of the raw powder itself. Here, manufacturers can use CT to analyze high-resolution models of individual grains just a micron or two across, scanning for porosity and irregular grain shapes or sizes that, in large enough numbers, might negatively impact finished-part integrity.
Contamination is also a concern for manufacturers using metal 3D printing, and it’s only through strict material handling and sourcing procedures that it can be avoided. Still, it’s critical to have the means to find contamination when it does occur and identify any uses of recycled or “non-virgin” powder. These occurrences are easy to spot with CT scanning, however, with faults appearing as bright spots within the part image.
Examining the complexities of composites
Because many composite products used in aerospace push the boundaries of lightweighting and performance, deep interior part inspection has become even more critical when these materials are used. An array of digital tools is now available to analyze CT-scans for material density, orientation of reinforcement structures, internal defects originating from design and manufacturing flaws or overload, and strain patterns calculated from multiple scans of different states of a sample using digital volume correlation.
Any structure can be captured and characterized against its design intent. Templates can be created to rapidly and repeatedly analyze part features and problems automatically. This includes porosity analysis (e.g., the pore volume and distance from the surface); fiber and resin analysis for local fiber, fabric and roving orientations; and derived statistics like orientation histograms or orientation tensors, fiber volume fractions, porosity within the resin and more. Depending on the material at hand, there are inspection solutions for each fiber architecture (short, long and continuous), layup pattern (uni-directional or with specified angle per ply) and bonding material (resins, fabrics, silicon, etc.).
All the data can undergo simulation from outside FEA tools and then be captured and used for material modeling and structural simulations, helping to build comparative models for both R&D purposes and component design. In appropriate cases, such analyses are even applicable for inline inspection (ILI).
Of course, there is no industry more safety-bound than aerospace, which often employs fiber composite material analysis (FCMA) to ensure quality and certification. Many of its applications use unidirectional (UD)-reinforced materials when the loading direction is a certainty.
A good example is helicopter rotor blades. Detection of deviation between desired and actual fiber orientation in these blades is critical because the fiber can only support loads in one direction. Helicopter blade production is largely characterized by manual work done by highly trained individuals. Every component of such a safety-critical product is checked against specifications for defects such as pores, delaminations or waviness in the fiber deposition.
This is where the detailed orientation analysis provided by advanced software comes into play. CT-based analysis can expose deviations in fiber orientation, which can vary blade by blade, allowing results to be easily reviewed by engineers. Until industrial CT came along, the only way to inspect rotor blades was to destroy them. This practice consumed a large number of samples, a costly practice.
No matter what manufacturing method or material is employed in the creation of aerospace parts and components, CT scanning can nondestructively provide a wealth of highly useful information about any product’s integrity. Sophisticated software is now available to query that data digitally, delivering deeper insights into almost every aspect of structure and physics affecting part performance. Employing such analysis and visualization tools can ensure that every aspect of production is reaching the astronomically high levels of quality demanded by the aerospace industry
Images Source: Volume Graphics
Ian R. Lazarus is president and CEO of Creato Performance Solutions, providing leadership development, training, and solutions to support operational excellence.
Philip Sperling, product manager additive manufacturing, Volume Graphics. For more information, email philip.sperling@volumegraphics.com or visit www.volumegraphics.com.
Jim L. Smith has more than 45 years of industry experience in operations, engineering, research & development and quality management.

July 2022 | Volume 61 | Number 7