Management
Concerns about COVID-19 are down, but inflation worries are up. Results are in for the 22nd Annual Quality Spending Survey.
By Michelle Bangert
The Spending Forecast is Here
The world looked a lot different in the fall of 2021.
Back then, COVID-19 was a top concern for more than half of respondents in our September 2021 survey. Today that number is down to 17%, according to our Annual Quality Spending Survey, which surveyed subscribers in September 2022.
While current events continue to change, the spending categories remain remarkably stable. Year after year respondents want their CMMs, scanners, and software. These products continue to be in demand every year, but of course, new technologies are joining the fold. Almost every emerging technology category saw an increase—from additive manufacturing to APIs—whether respondents are using them now or just beginning to plan for them.
Clear Seas Research, in conjunction with Quality, conducted the 22nd Annual Spending Study in order to determine actual spending for quality assurance and control equipment, systems, software, and services compared to the projected/budgeted amount as well as the change in budget allocation within quality equipment and service categories. And finally, we wanted to get a pulse on the quality professional themselves and see how their approach to quality today compares to a year ago.
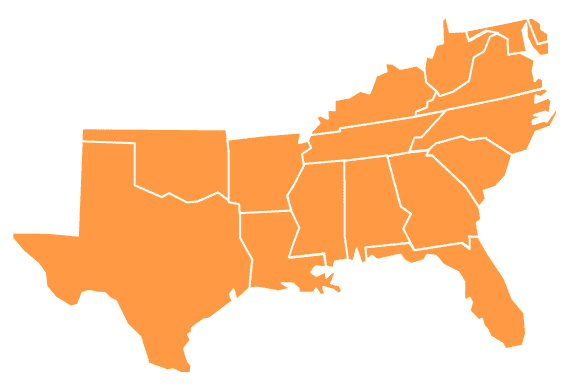

South
Northeast
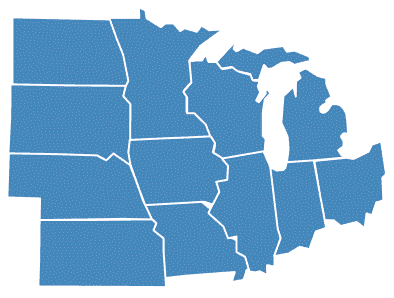
Midwest
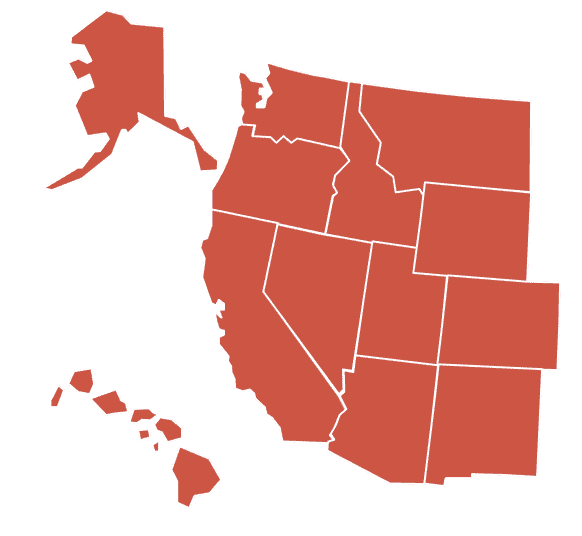
West
Region
The Outlook
Before we examine what quality professionals will be purchasing and why, let’s take a look at who responded. For almost two-in-three respondents, the top manufacturing operation at their location is assembly. Next comes machining, done at nearly half of locations.
Respondents come from locations with an average of 415 employees, with 74% of company locations employing fewer than 250 employees.
These locations are scattered across the U.S. This year 39% of respondents came from the Midwest, 22% from the South, 21% from the Northeast, and 18% from the West.
What are they making? The largest number of respondents came from companies in aerospace products/parts manufacturing, medical equipment and supplies manufacturing, plastics and rubber products manufacturing, and fabricated metal product manufacturing.
Respondents themselves came from quality management (34%), along with quality engineering, corporate management, manufacturing engineering, and manufacturing management/operations. Other categories included research and development, technical engineering and purchasing.
The Budget
More than half of respondents reported that their 2023 budget had already been started as of mid-September, and many were on their way to finishing.
Three-quarters of respondents report that they will have an approved quality equipment/services budget for fiscal 2023 in 2022, with 58% finalizing this in the fourth quarter of 2022. Twenty-one percent finish in October, 19% in November, and 18% in December.
But if you are still working on this year’s budget, you are not alone. Twenty percent will be finalizing their budget in the first quarter of 2023. Twelve percent of respondents will finalize their 2023 budget this month, 6% next month, and 3% in March.
The Outlook
What are you worried about now?
Unlike this time last year, COVID is not as pressing of an issue for respondents. Supply chain interruptions (69%), current economy/inflation (63%), and skilled labor shortages (56%) were the top three concerns.
While these were also the top concerns last year, the numbers have changed. This year, the economy/inflation was more of a concern but supply chains and skilled labor weren’t as troubling.
COVID was actually the least concerning issue for respondents at 17%, down from 52% the year before.
The Importance of Quality
Through the changes, the importance of quality has not diminished. For almost all (98%) of respondents, it is just as important as ever or even more so. For some, the importance of quality has risen significantly: 18% say it is much more important.
As we consider the projected and actual budgets, let’s look at how the budgets played out in years past. According to respondents, 17% said that their 2021 actual spending was over budget, on average by 17%. For the 21% who said their spending was under budget, this was on average by 23%.
As they considered the fiscal budget, 69% projected their 2022 budget to be on track with the budget set in 2021. The remaining group was divided equally among those who thought it might be over budget or under budget, with 15% for each category.
In terms of 2023 spending, almost half of respondents (48%) anticipate spending the same as 2022. Almost as many anticipate spending more, with 43% expecting an increase, by an average of 19%. Only 9% expect a decrease in the budget, on average by 25%.
For those who plan to increase their 2023 quality assurance/equipment/service budget, reasons include improving productivity, reducing scrap and rework, increasing production capacity, reducing costs, and replacing equipment.
Whatever the reason, respondents said now is the time to start spending. Twenty-five percent expect to make their first purchase for the fiscal year in January, with 61% planning to make this purchase sometime in the first quarter.
The inspection approach remains consistent. Lot sampling continues to be the most common approach to incoming (50% of respondents) and in-process testing/inspecting (41%). For final inspections, almost half of respondents’ companies test or inspect every part or product.
What to Buy
We’ve looked at the timing and the reasons for the investments, but now let’s look at what respondents plan to buy.
General-use test/measurement/inspection equipment, test/measurement/inspection services, and/or gages/gaging systems top the list of purchases for fiscal 2023.
The list goes on. Other planned purchases include: product testing equipment, software, consulting and training services, optical inspection and measurement equipment, materials test equipment, nondestructive test equipment, form and surface measurement equipment, CMMs, and color and coating thickness measurement. Ninety-six percent of respondents said they plan to purchase at least one of these items.
Let’s look into these product categories more closely, starting with one of the quality workhorses—a CMM.
Seventeen percent plan to purchase a CMM, and CMM spending looks set to increase. Almost half of respondents predict their company will spend $100,000 or more on a CMM in 2023, which is higher than budgets set in this category for 2022.
In terms of form and surface measuring equipment, the budget is less than $5,000 for almost a third of respondents. Spending for 2023 is predicted to remain the same.
Gages are a staple of a quality program and the budget reflects this. Budgets for gages and gaging systems for 2022 and 2023 look similar, with the majority of respondents budgeting under $60,000. Handheld gages lead the gaging budget with 27% slated for them. Custom/specialty gages, a new category in 2021, jumped from 7% to 13%, making them the number-two category. Fixture and special tooling gages, thread gages, plug and ring gages, thickness gages, bore gages and depth gages are next. Air gages, turnkey and in-process gaging systems, fixed limit gages, snap gages, gear and spline measurement, and ball gages round out the list.
Forty percent of respondents budgeted less than $10,000 for optical inspection and measurement equipment in 2022. Fifty-nine percent expect this year’s budget for this equipment will remain the same, and 35% expect an increase. Twenty-four percent of this category will be spent on machine vision systems.
The budget for color and coatings thickness equipment is anticipated to be similar to 2022. Three-fifths of respondents’ companies budgeted less than $10,000 for this equipment in 2022, and spending for 2023 looks like it will follow this trend.
Material testing equipment looks poise for a jump. One-third of respondents expect to see an increase in spending on material testing equipment next year, which is higher than last year’s predictions. Hardness testing leads this category at 17%.
In terms of nondestructive testing (NDT) equipment, the majority (77%) expect their spending to remain the same. For about half of respondents, the 2022 budget for this equipment was $10,000 or less, and this looks set to continue this year. Ultrasonic testing lead the category with 17% of the NDT budget.
For general-use test, measurement and inspection equipment in 2022, three-quarters of respondent companies budgeted less than $60,000. For most, 2023 will bring a similar pattern. Calibration equipment dominates the category, taking up half of this budget.
Nothing gets done without software, and more than half budgeted less than $20,000 for this item. This looks set to continue in 2023.
For consulting and training, the majority of respondents expect no changes; Seventy-nine percent anticipate the 2023 budget will remain the same. Twenty-eight percent of this budget will be spending on certification/registration. Quality management and process improvement are slated for nearly one-third of this budget.
Adopting New Technology
While many of the previous categories have been around for a long time, there are some emerging technologies to highlight.
When looking at the past two years, the trend is up for most technologies, with respondents saying they currently use them or are planning to within the next few years. These include cloud computing, automation, additive manufacturing, robots, digitization, wireless sensors, APIs, internet of things, and integration of smart connected machines and manufacturing assets with the wider enterprise. Other categories include on-the-job required mobile devices, artificial intelligence/predictive data analytics, drones, augmented/virtual reality, and blockchain technology.
For additive manufacturing, use has jumped from 36% to 47%. Use of application programming interfaces (APIs) climbed up to 24% from 16%.
No matter where respondents were on the adoption timeline, more of the respondents reported that they were at least discussing the use of these technologies in the coming years.
Methodology
The survey was sent to domestic active qualified subscribers of Quality. The survey was fielded September 14-27, 2022. Each respondent that participated in the study received a $10 gift card. This year we received 303 useable responses. Thank you to all those who participated.
Opening Image Source: pixhook / iStock / Getty Images Plus via Getty Images.
Michelle Bangert is the managing editor of Quality.
January 2023 | Volume 62 | Number 1