H2 Deck By Bold Name
h2 xxxxxx
H1 xxxxxx
h2 xxxxx

Software & Analysis
This is Arthur’s 4-50 Rule—4% of anything produces 50% of the benefits or problems. By Jay Arthur
Arthur’s 4-50 Rule
Software & Analysis
H2 Deck Info By Paragraph Style Bold
Headline
In the late 1800s, Vilfredo Pareto observed that 20% of Italians held 80% of the wealth. This has since become known as the 80/20 rule—20% of what you do produces 80% of the benefit. Similarly, 20% of any business produces 80% of the mistakes, errors, waste and lost profit. Where Vilfredo Pareto thought it only applied to wealth, Quality visionary Joseph Juran generalized it to all phenomena, especially defects. Juran actually gave this rule a name: Pareto’s Rule. Juran later said he wished he’d named it “Juran’s Rule” so that he would have gotten credit for it.
Over the years, working with data from industries as varied as manufacturing to healthcare, I have found that Pareto’s Rule doesn’t go far enough. Since the 80/20 rule is a power law, the distribution also applies within the 20%. So as little as 4% contributes over 50% (Figure 1).

In America, 4% of population holds over half the wealth. Four city blocks out of 100 have over half the crime. This means that when you boost patrols in those four blocks, crime goes down. Four percent of Boy Scouts become Eagle Scouts—the superstars. This is true of any sport or job. Four percent will become the stars.
Having learned from Juran, I call this Arthur’s 4-50 rule.
This distribution applies in other areas—4% of the knowledge about any subject will deliver over half the results. This means that you don’t need to know everything to do anything. You just need to know the essence. There exists, in any field of knowledge, the vital few things you need to know to succeed. This is true of Lean Six Sigma.
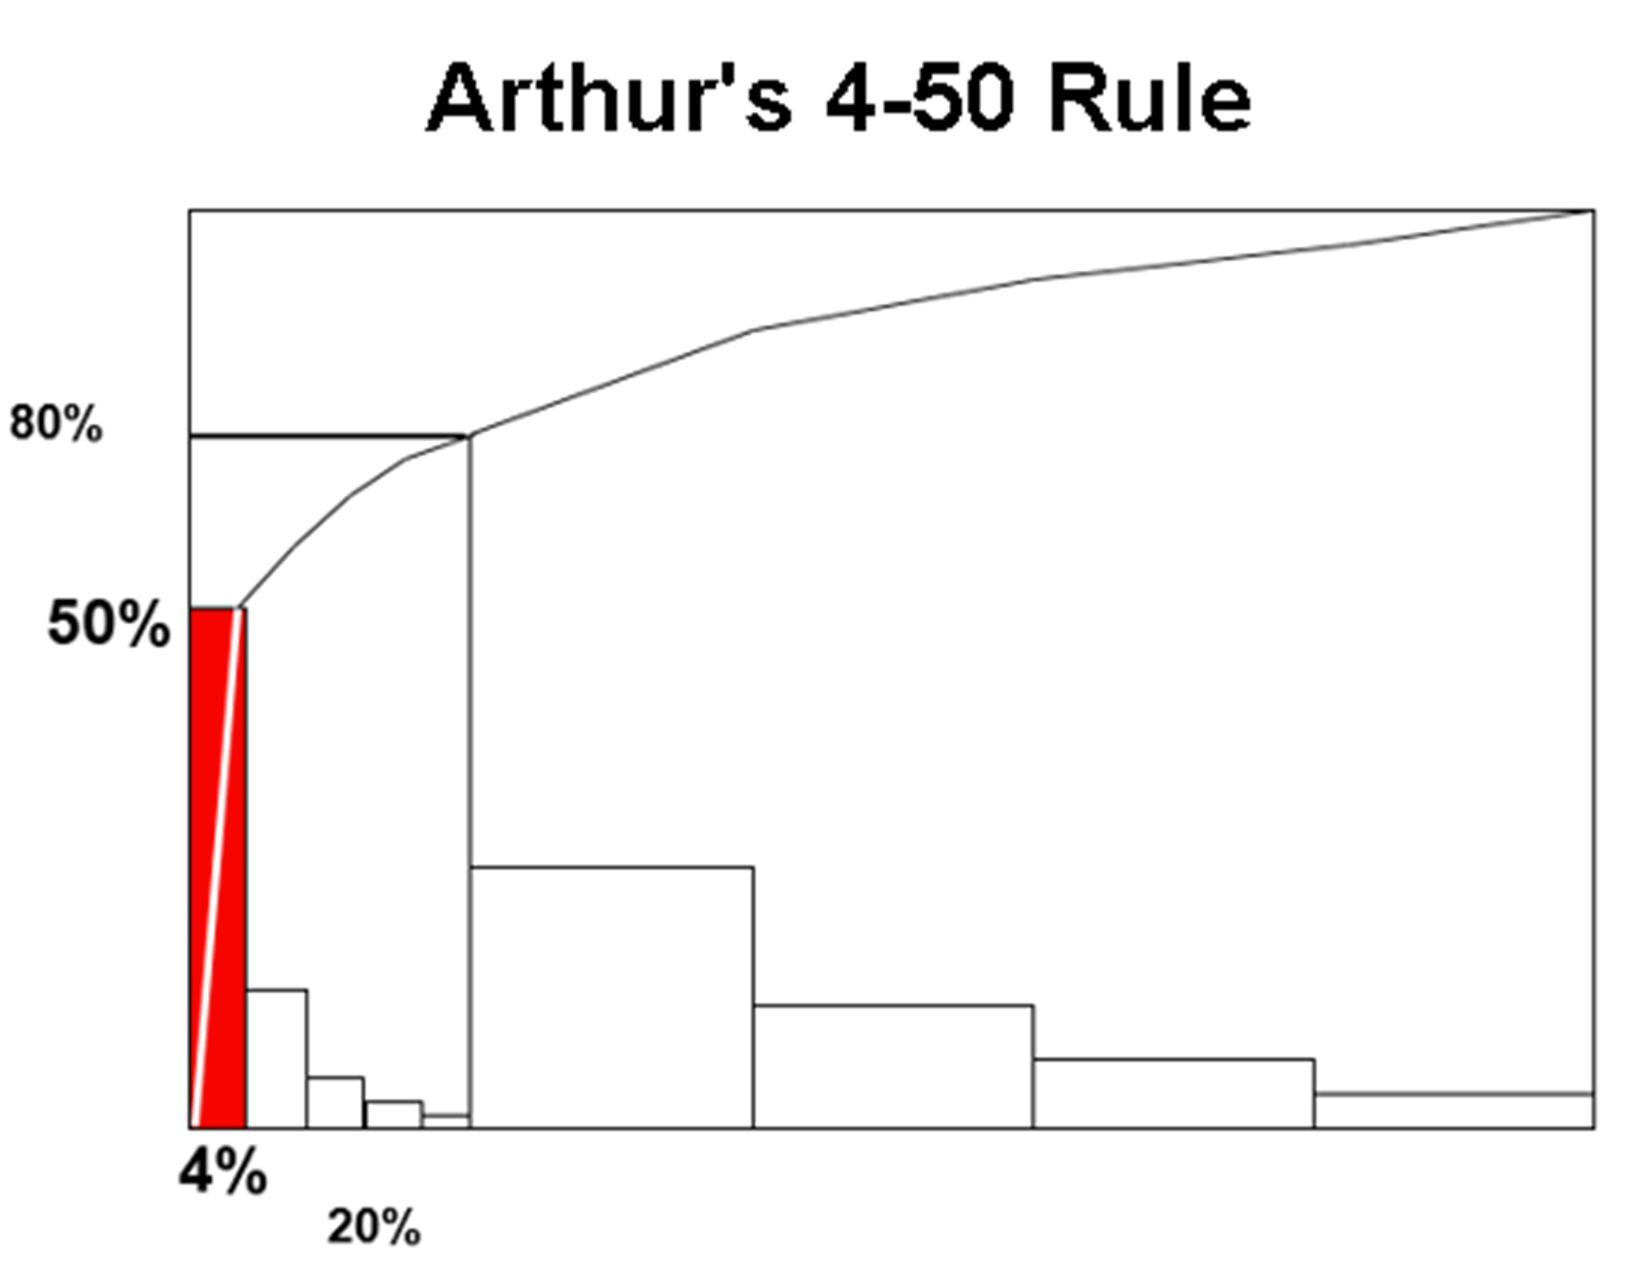
Figure 1.
In business, 4% of customers generate half of the sales. Four percent of customers also cause over half the customer service issues. This means that you can stop catering to the crybabies and start scouting more customers like the top 4%.
In business operations, 4 steps out of 100 cause over half of the mistakes, errors, waste, rework, lost productivity, lost profits and patient harm. This means that you don’t have to fix everything in your business, just the one step out of 25 that is the Million Dollar Misstep.
This is Arthur’s 4-50 Rule—4% of anything produces 50% of the benefits or problems. The dark side of the 4-50 rule—the 50% at the other end will produce only 4% of the benefit or problems.
The Pareto Chart
While Juran named Pareto’s Rule, I believe that Dr. Kaoru Ishikawa invented the Pareto Chart. His Guide to Quality Control (1968 pgs.42-49) shows the first Pareto chart—a sorted bar chart and a cumulative line chart. (Note: He called it a Pareto Diagram.) Here’s an example (Figure 2, pg. 43):
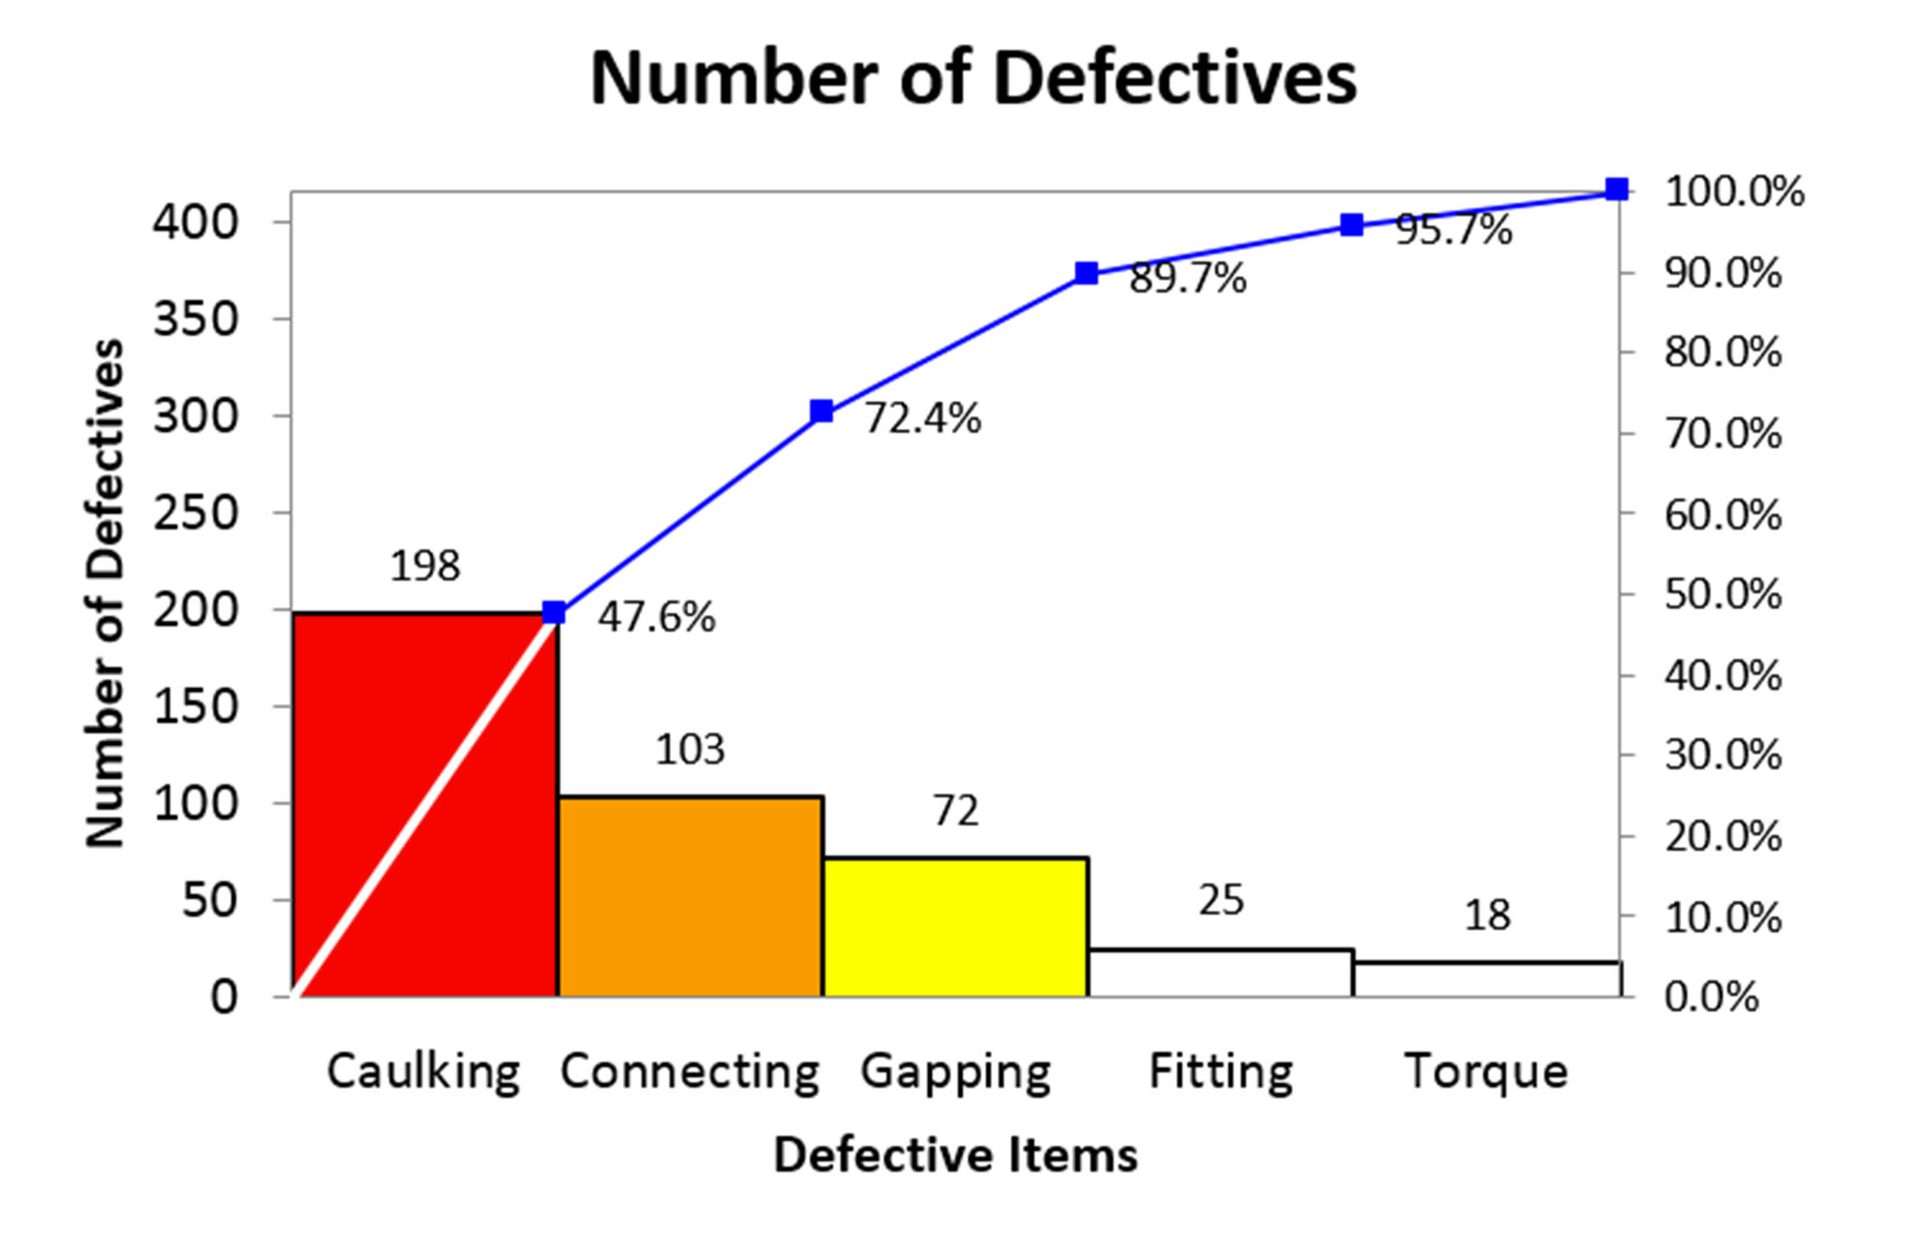
Figure 2.
Using Excel PivotTables and Pareto charts, it’s possible to use the 4-50 rule to pinpoint and solve the most pressing problems.
Arthur’s 4-50 Rule in Quality Improvement
Using defect data that looks like that shown in Figure 3, it’s possible to use PivotTables to start drilling down into data to find the 80-20 and 4-50 rule. This data shows the when, where and what of packaging defects.
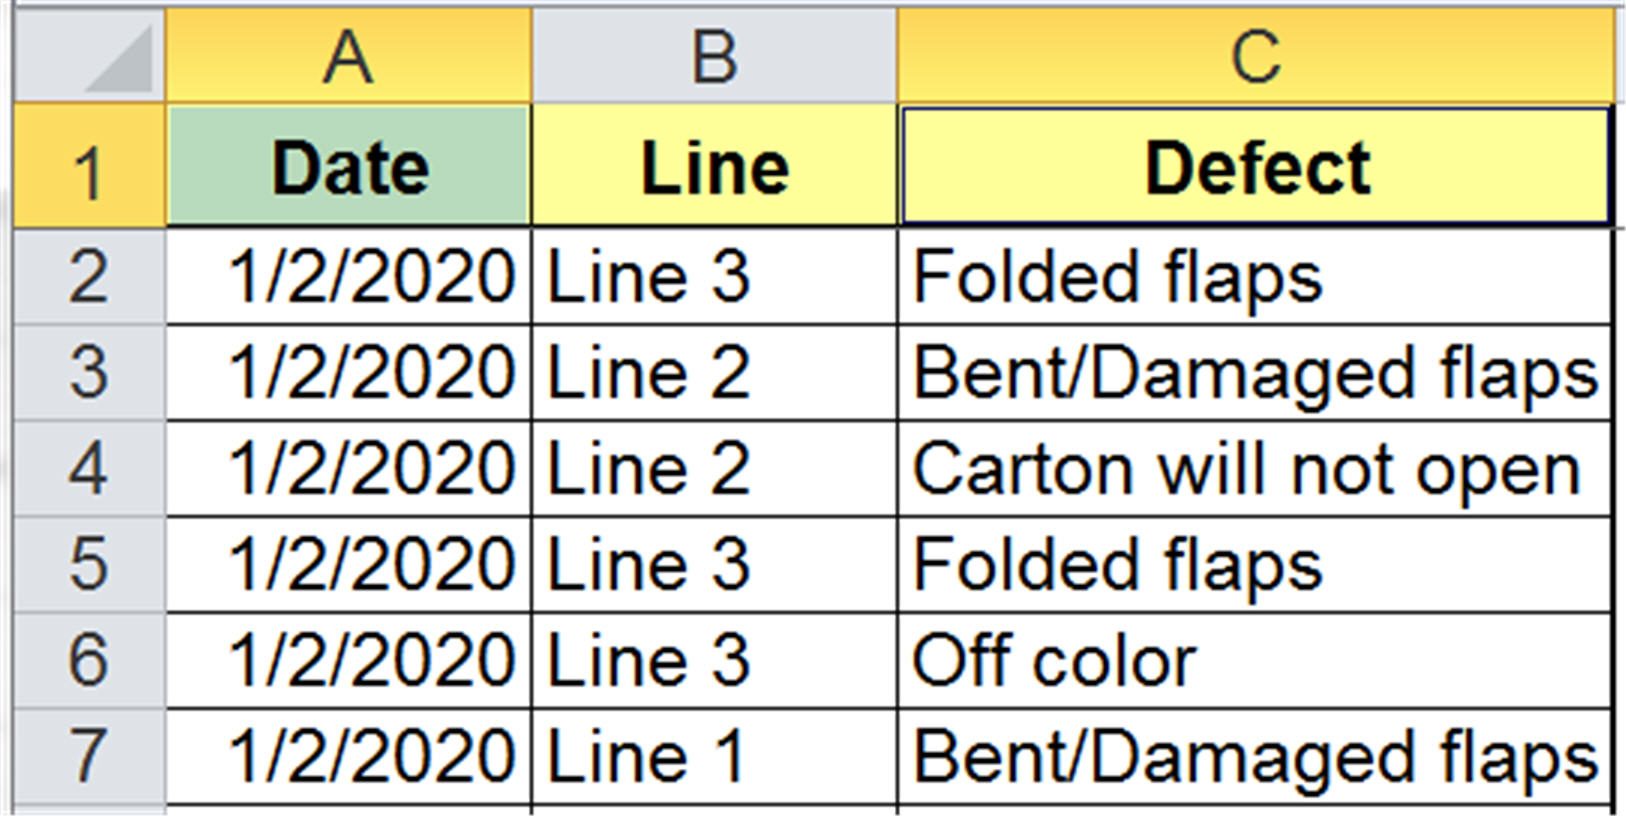
Figure 3.
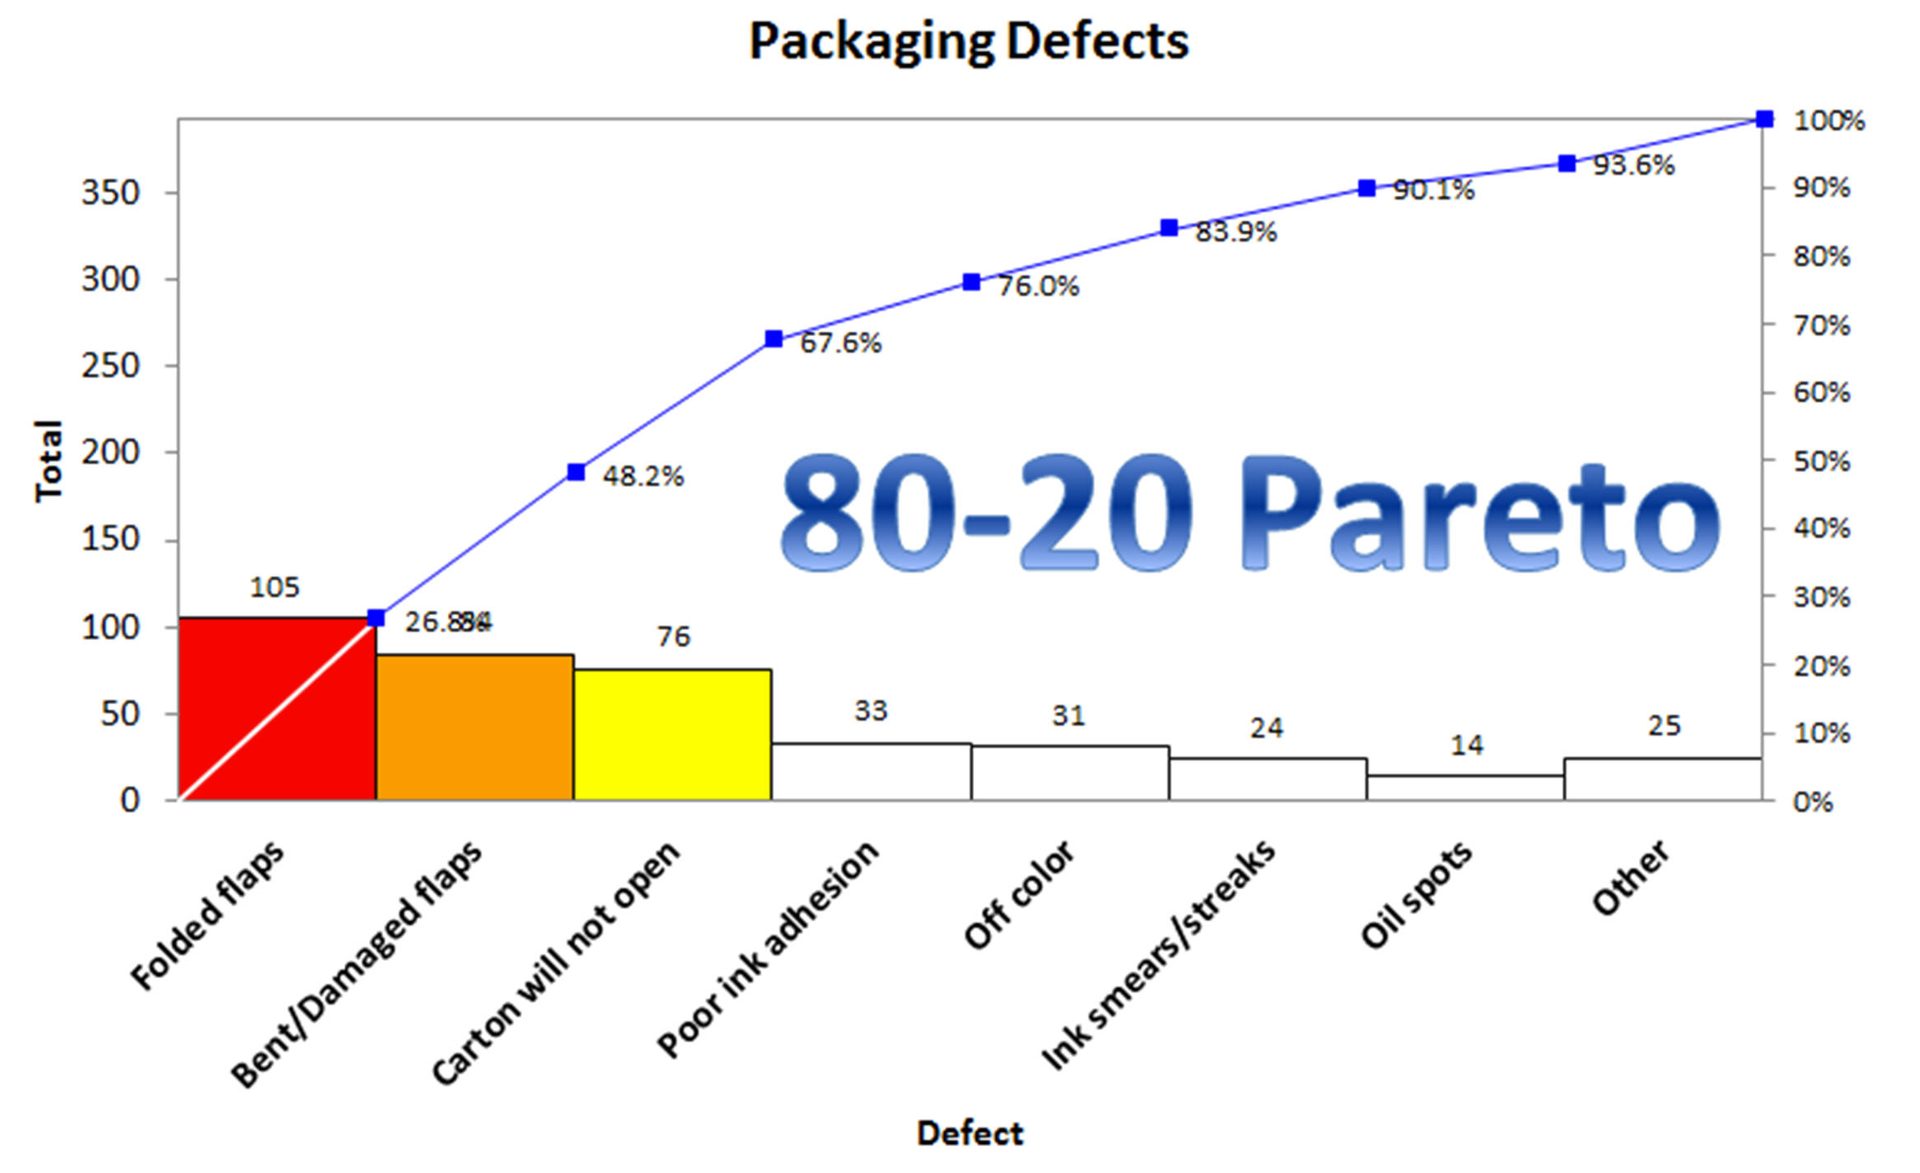
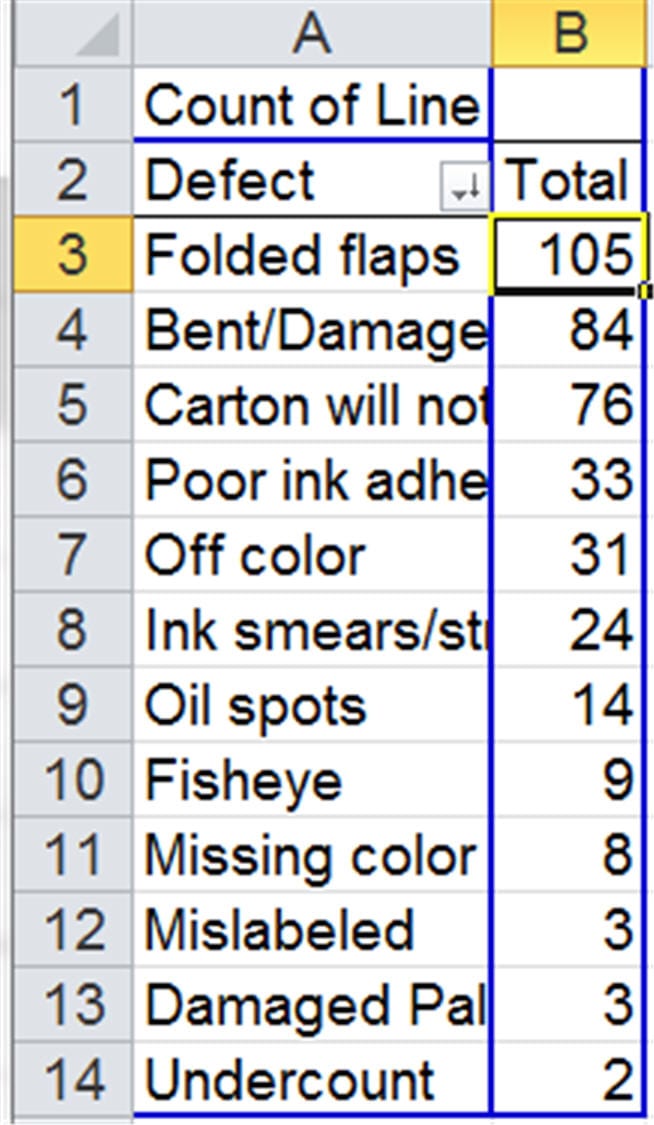
Figure 4.
Figure 5.
Using PivotTables, one can summarize the number of times each type of defect is found in packaging (Figure 4).
Which can then be turned into a high-level, 80-20 Rule Pareto Chart (Figure 5).
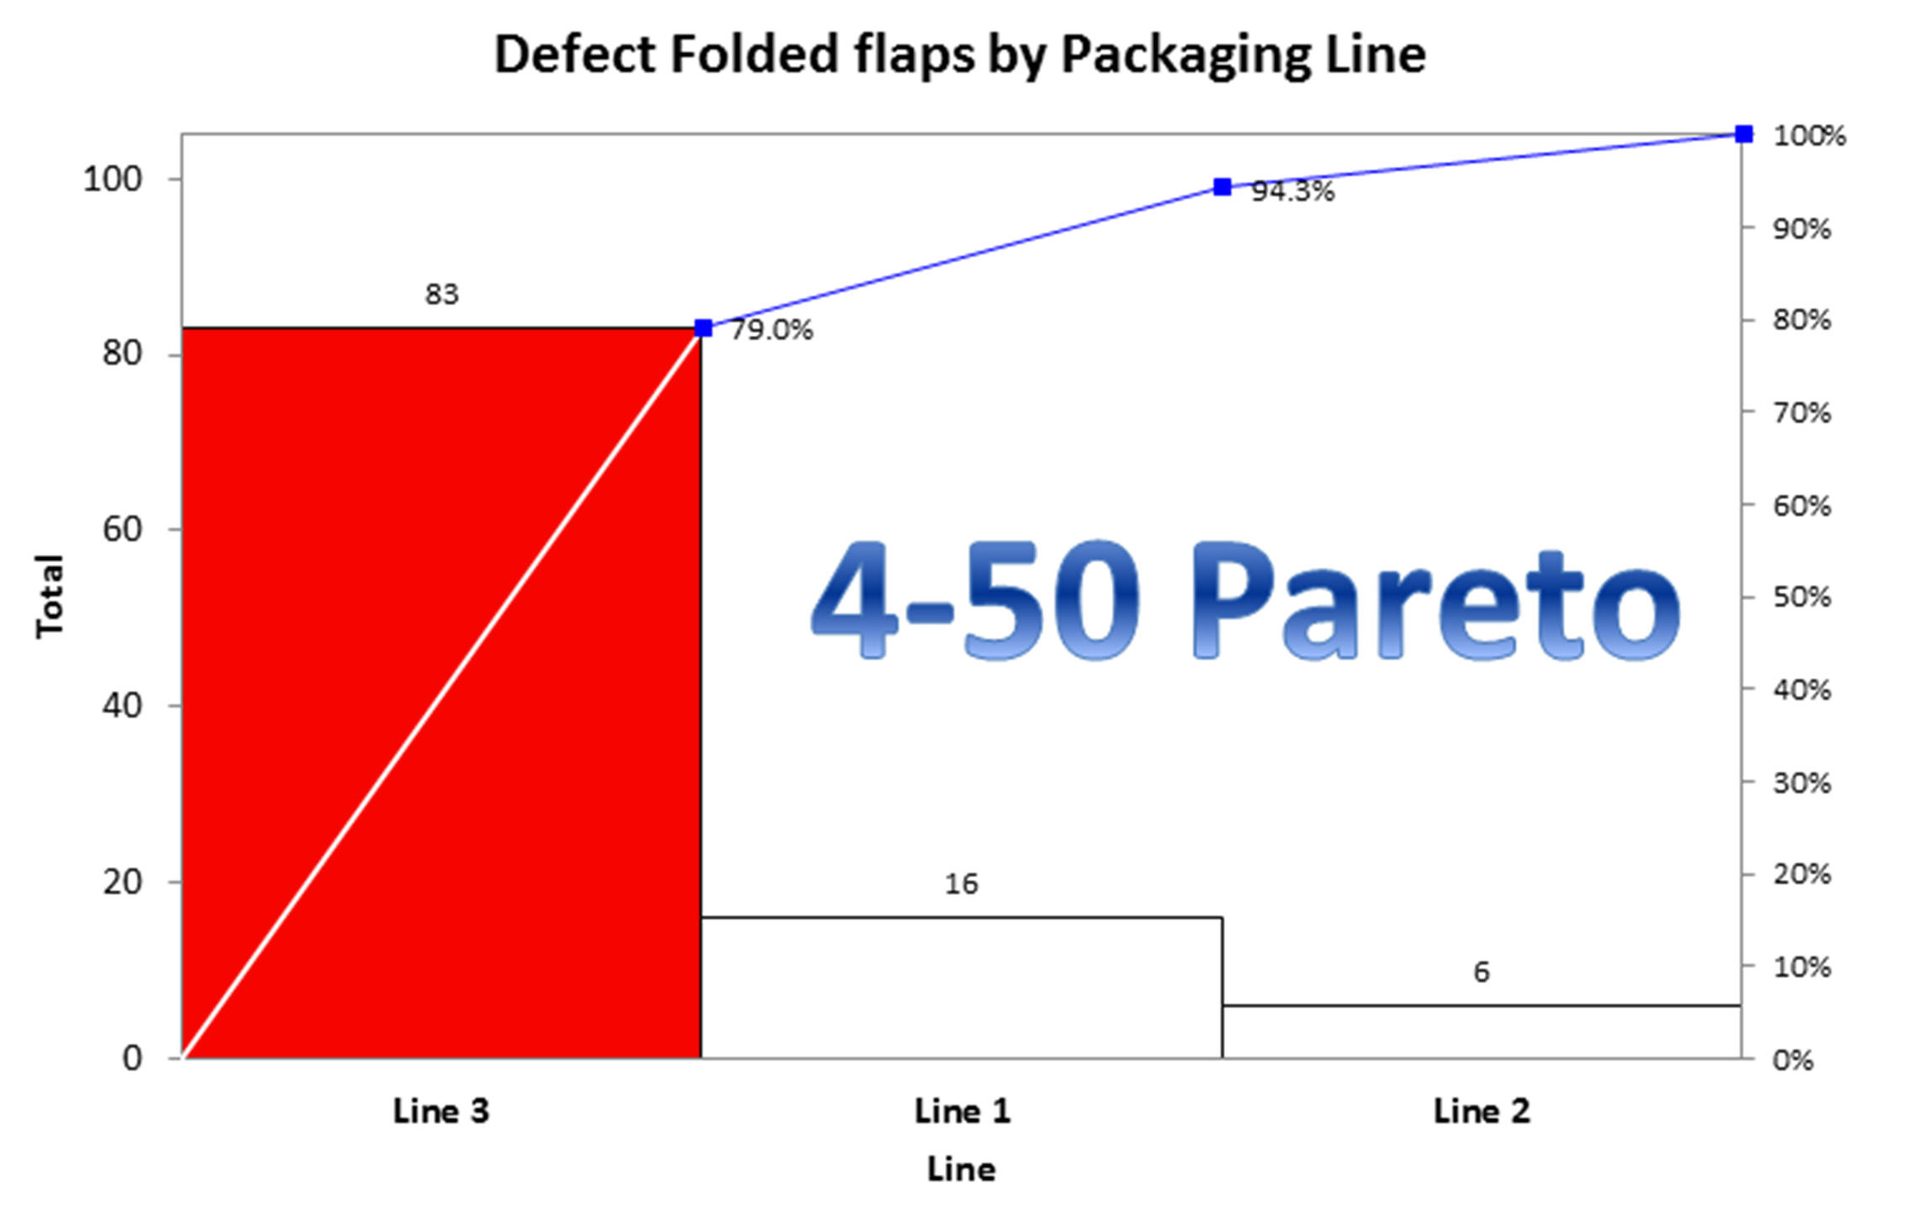
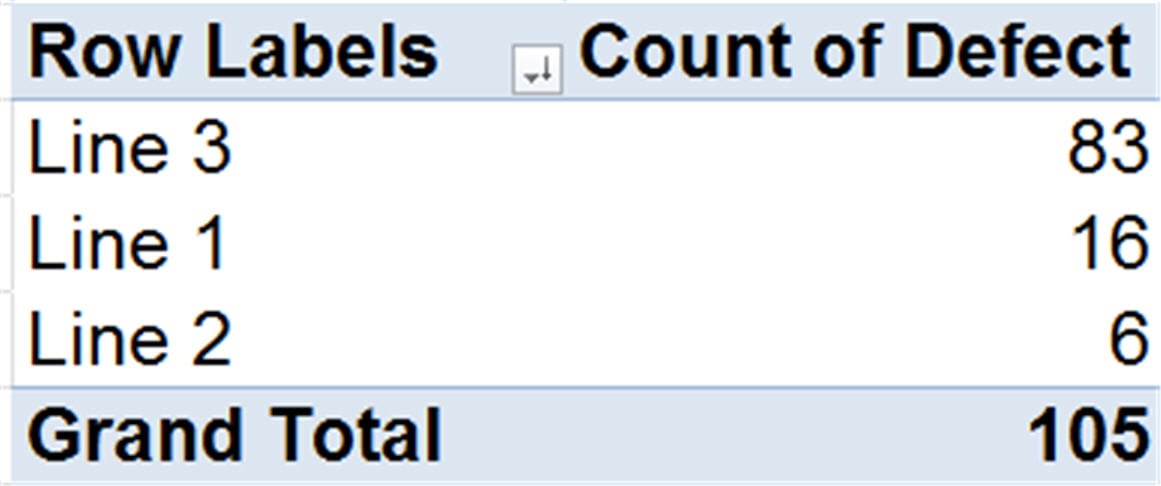
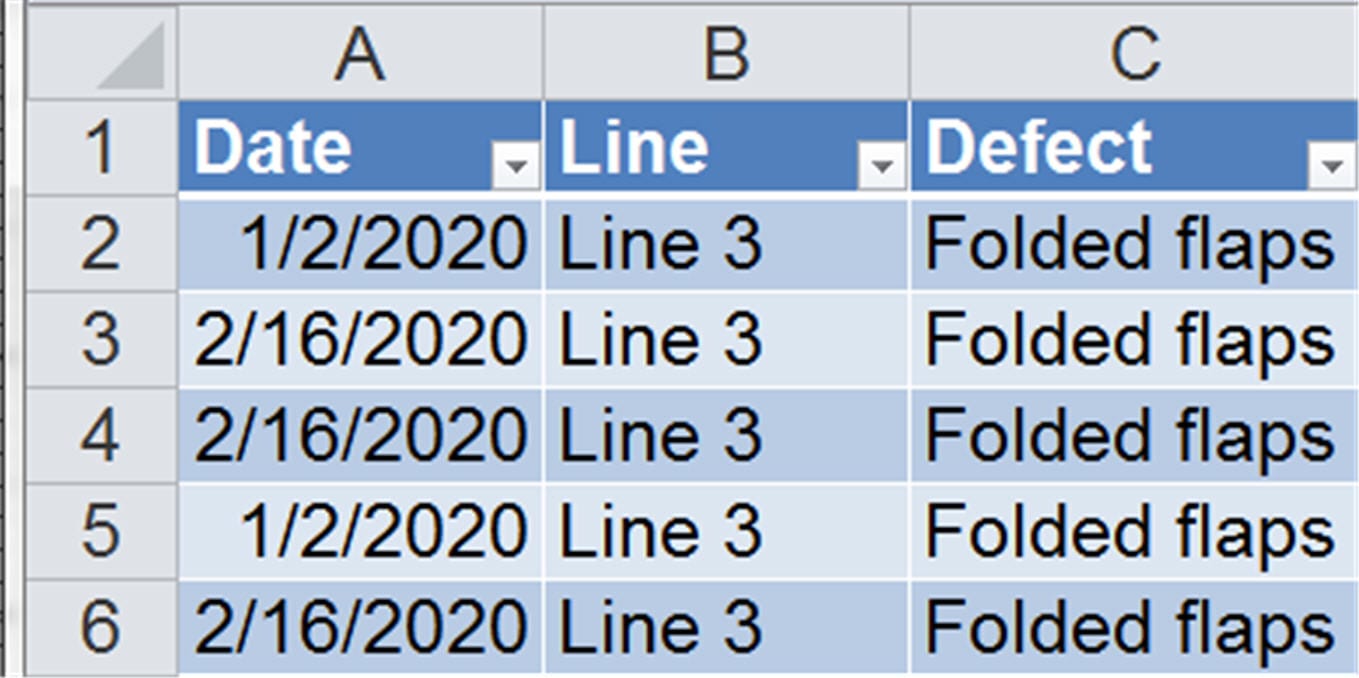
Figure 6.
Figure 7.
Figure 8.
In Excel, if you double click on the 105 for Folded Flaps, Excel will pull all of the data behind that sum (Figure 6).
Then, we can use another PivotTable to summarize where the Folded Flaps defects are found (Figure 7) and create the 4-50 Rule Pareto chart (Figure 8).
Line 3 creates 79% of the Folded Flap defects. At this point, we know who should be on the root cause analysis team—people on Line 3 that know something about Folded Flap defects. We don’t need people from Line 1 or 2.
Ishikawa (Fishbone) Diagram
By narrowing the focus to the big bar on the 4-50 Rule Pareto chart, I have found that we often end up with a minnow-bone diagram (Figure 9), not a fishbone or whalebone diagram. This simplifies root cause analysis. It can often be done in an hour or two, not days. I have also found that whalebone diagramming is a sure sign that the problem hasn’t been laser-focused to the 4-50 Rule. Go back and drill down.
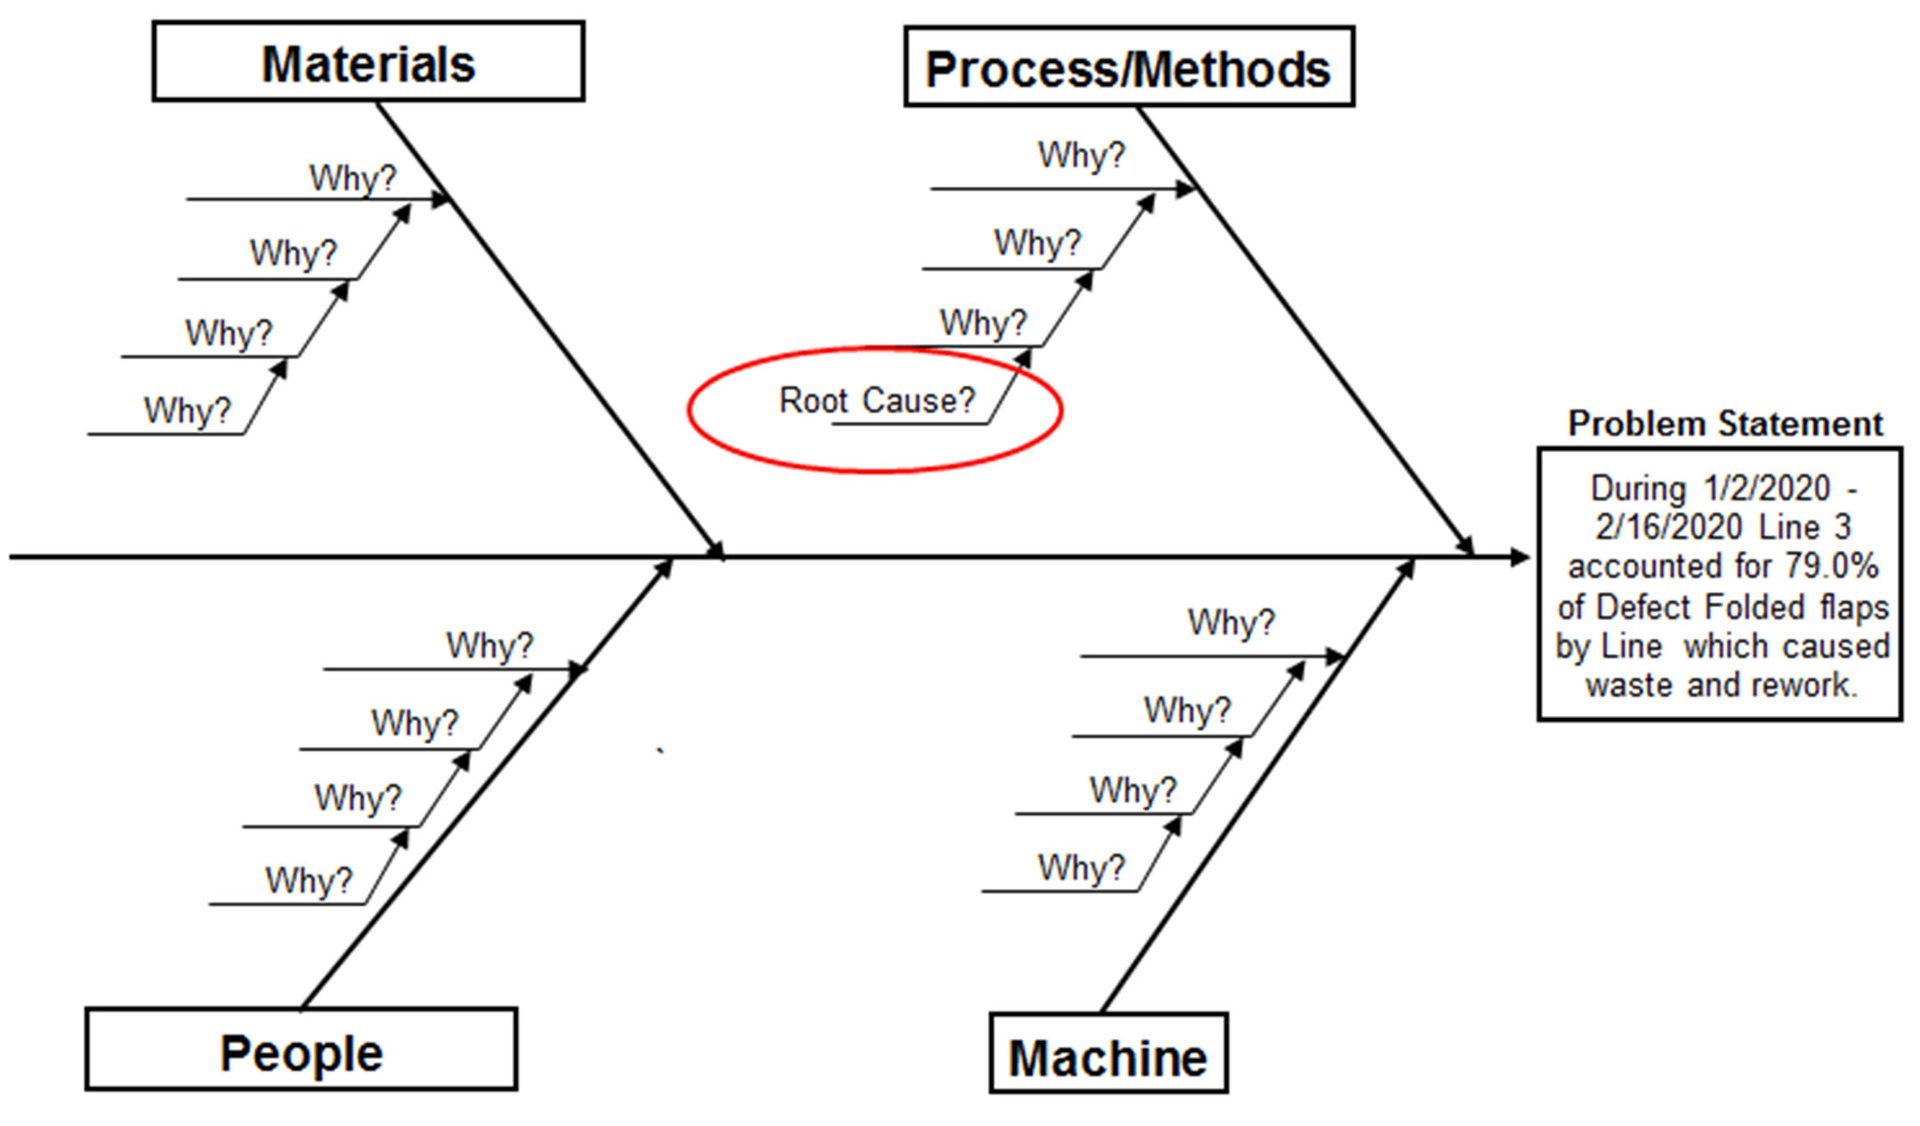
Figure 9.
It is also possible to drill down into the other two big bars on the 80-20 Rule Pareto chart—Bent/Damaged Flaps and Carton Will Not Open to tackle the other key problems in packaging. These three bars account for 67.6% of all packaging defects. Fix these and dramatic improvements in productivity and profitability are ensured.
Arthur’s 4-50 Rule
So that’s the power of the 4-50 Rule to pinpoint and resolve key problems. Using the 4-50 Rule, I have worked with a metal manufacturer to save $1,000,000 a year. With a hospital system, we were able to save $5,000,000 a year. That’s the power of Excel PivotTables and the 4-50 Rule.
Pareto’s power law still applies within the 4 percent (0.8% causes 51% of the problem), but I haven’t found data detailed enough to drill down another level. The 4-50 Rule is always enough.
So, where’s your pain in production or administration? Find the data.
Use Arthur’s 4-50 Rule to fix the worst first.