xxxxxx xx
xxxxxxxxxx
NDT
NDT
NDT
H2 Deck By Bold Name
h2 xxxxxx
H1 xxxxxx
h2 xxxxx

Management
This improves data quality in complex areas and broadens the scope of automated NDT systems where reliable digital models are unavailable. By Ahmad Chahbaz and Rene Sicard
Adaptive Scanning Solution for Automated Ultrasonic Testing of Aircraft Parts
H2 Deck Info By Paragraph Style Bold
Headline
Modern automated ultrasonic testing solutions designed to perform 3D scanning of complex aircraft parts are generally programmed from the inspected part CAD coordinates, assuming exact geometric conformity. However, dimensional variations between CAD and the as-built part can introduce inspection errors, since the inspection paths derived from CAD data used to complete the 3D trajectories fail to represent the physical reality precisely enough. Adaptive ultrasonic scan path generation allows ultrasonic testing systems to automatically follow the real surfaces, compensating for part deformation arising from residual stresses developing during the manufacturing process, or repair-induced variations. This article explains how an adaptive scan path solution works and what performance gains it delivers in practice.
How Adaptive Ultrasonic Scanning Path Generation Works
Adaptive scanning algorithm introduces a new layer of intelligence to automated UT scanning: instead of following a fixed scanning trajectory from part’s CAD, the system first learns the real surface and scanning paths, then recalculates and optimizes the motion trajectories to maintain correct probe orientation and stand-off distance throughout inspection.
Such a solution can be extremely beneficial for the inspection of composite materials, turbine blades, and aerospace assemblies, where the curvature changes rapidly and thickness uniformity is critical. Minor warping, thermal distortion, or rework can shift surface curvature by a few millimeters, enough to cause probe to part angle inaccuracies and cause important amplitude variations beyond acceptable ranges for a proper inspection. When the probe no longer aligns with the actual surface normal, echo strength drops, and false indications or losses of sensitivity may appear due to signal losses caused by probe misalignment rather than from true flaws.
The adaptive process follows four main steps:

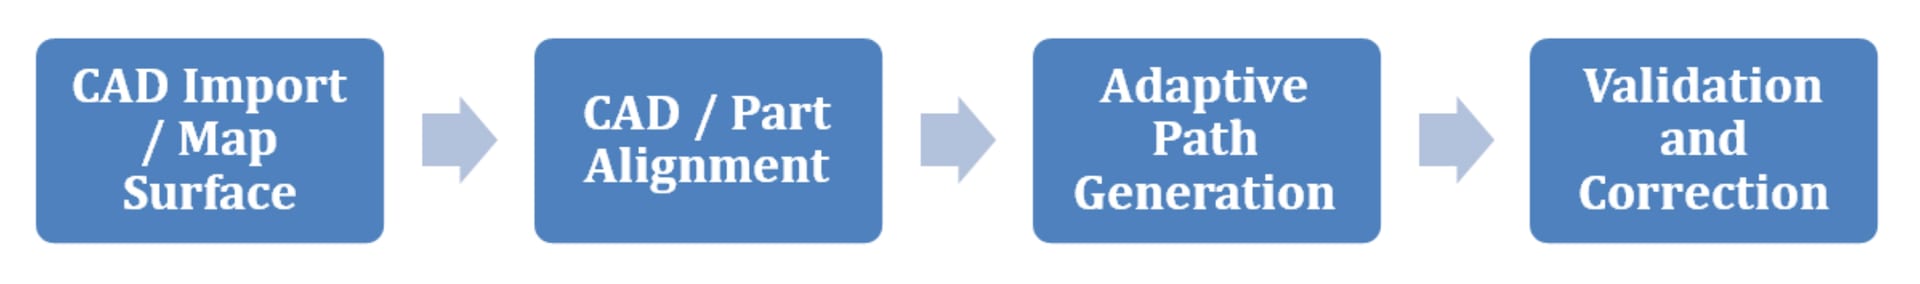
Fig 1. Adaptive scanning workflow diagram
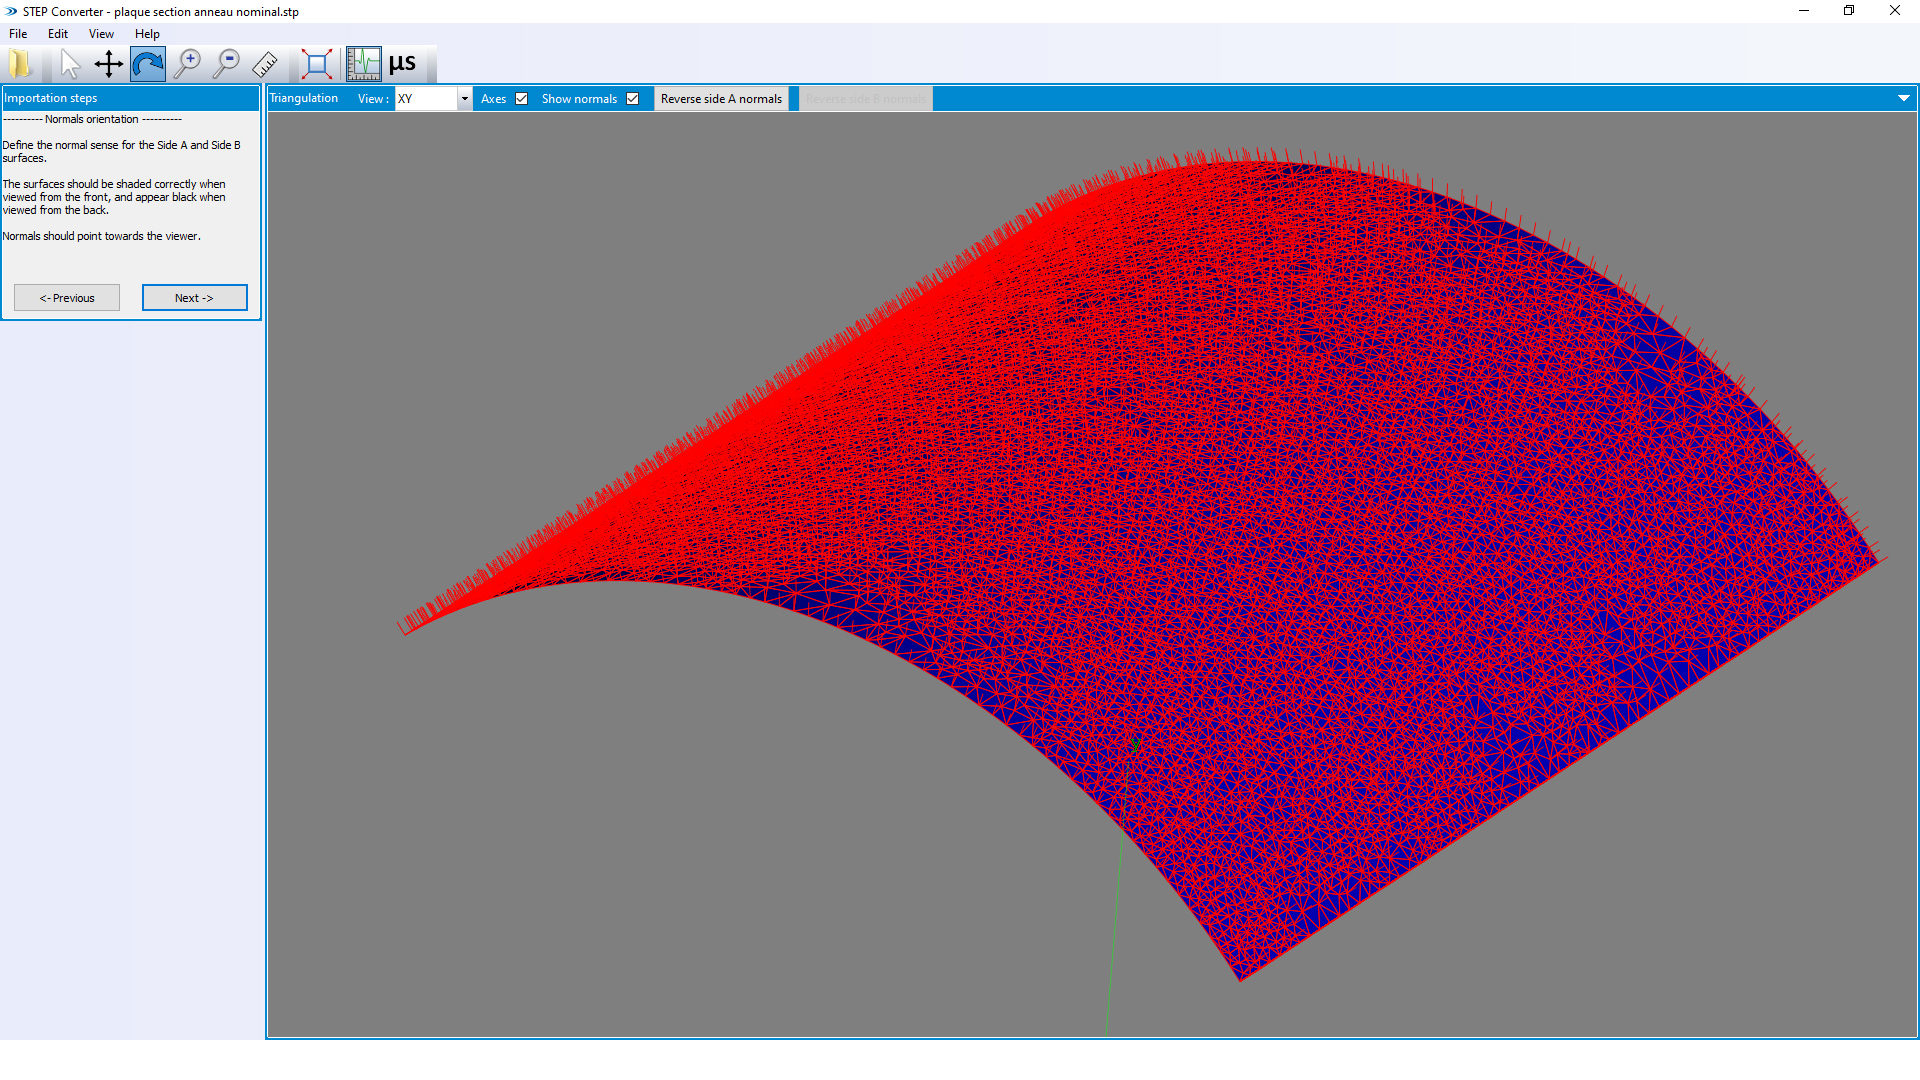
1. Surface / CAD Import: Using the scanner’s 3D control software, the CAD model of the inspected part is imported, forming a grid of points which is then interpolated and optimized to produce a smooth digital surface. Local surface normals and curvatures are computed, defining and optimizing how the ultrasonic probe should orient itself to remain perpendicular to the CAD surface while maintaining its stand-off distance. When no CAD data is available, a rapid surface-acquisition routine is performed to create the surface.
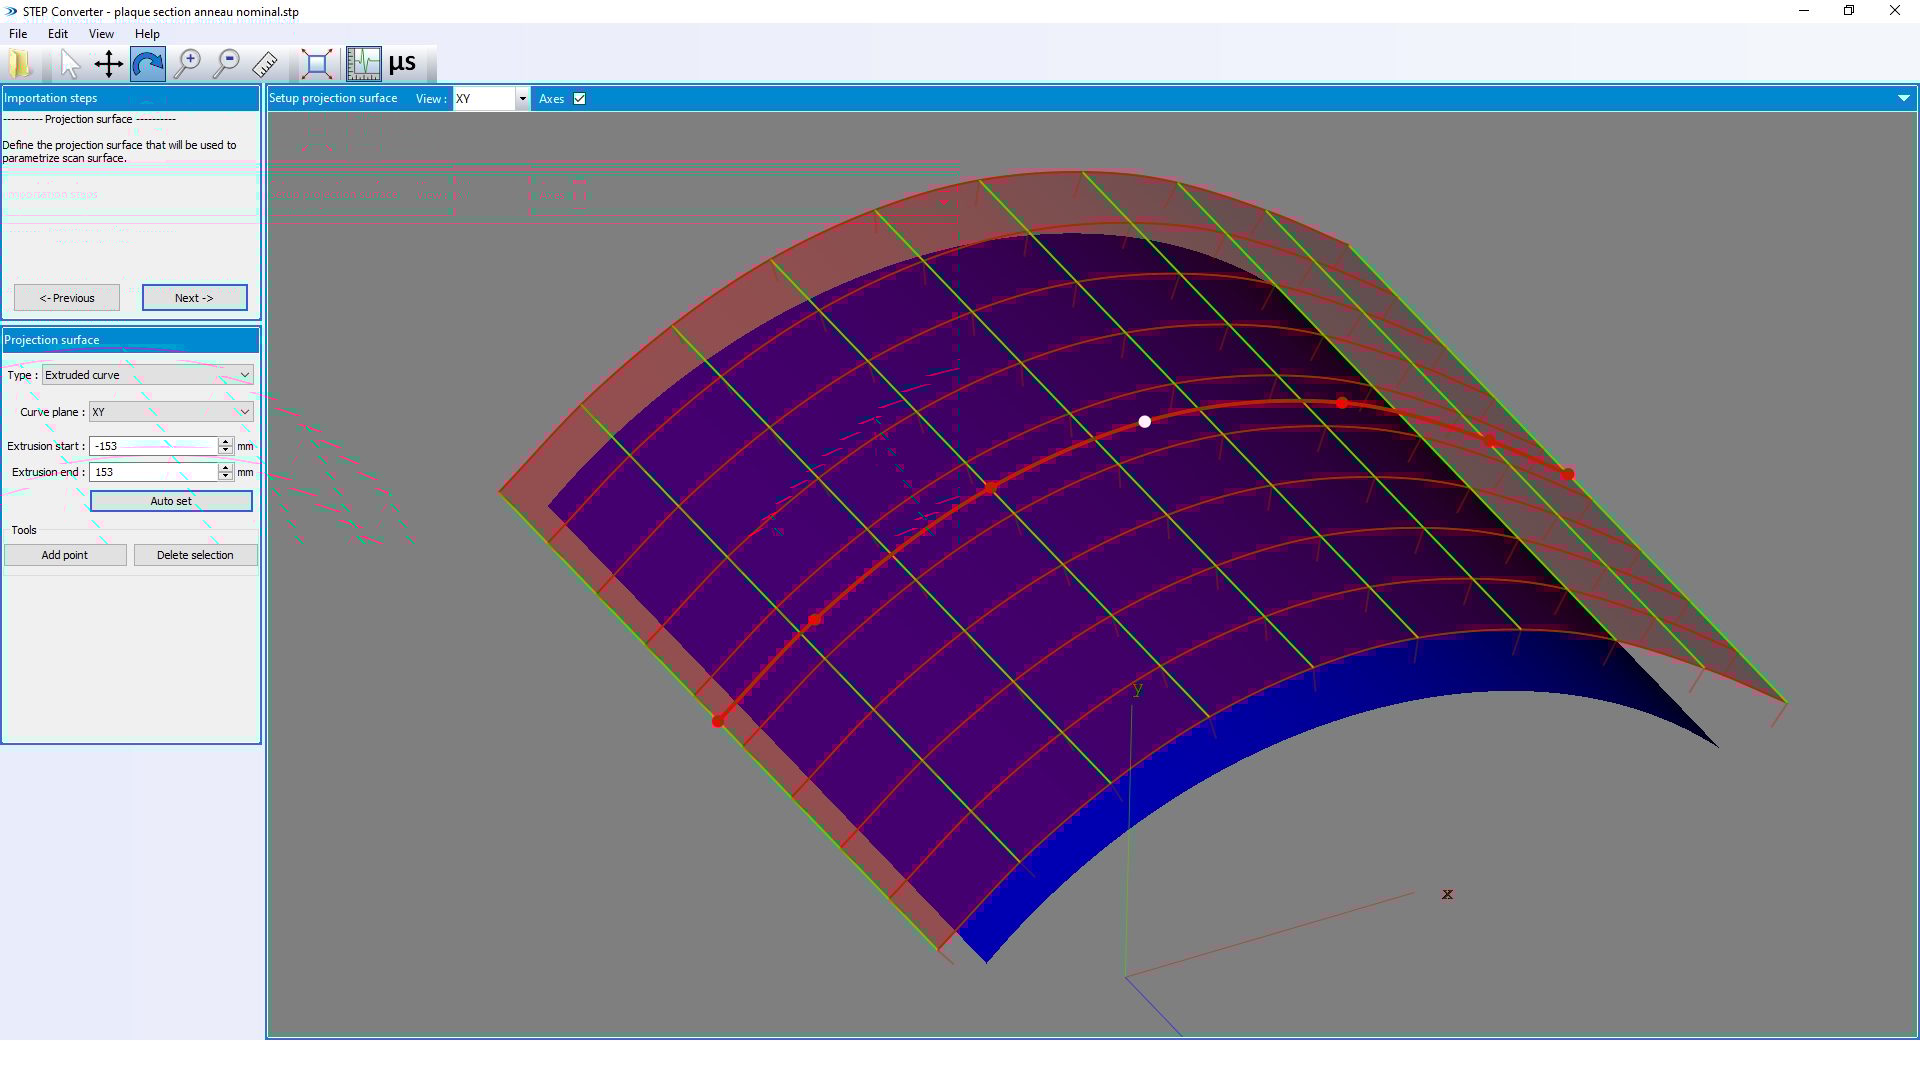
Fig 2. imported Surface/CAD: import steps converted to scanning trajectories
2. CAD / Part Alignment: To align an imported CAD model with a physical part, users can begin by teaching the part and generating a set of points representing sections of the geometry of the tested part. To ensure the good alignment, points located near the edges of the part are often excluded from the dataset, as these regions may contain distortions or measurement artefacts resulting from curvature or boundary effects.
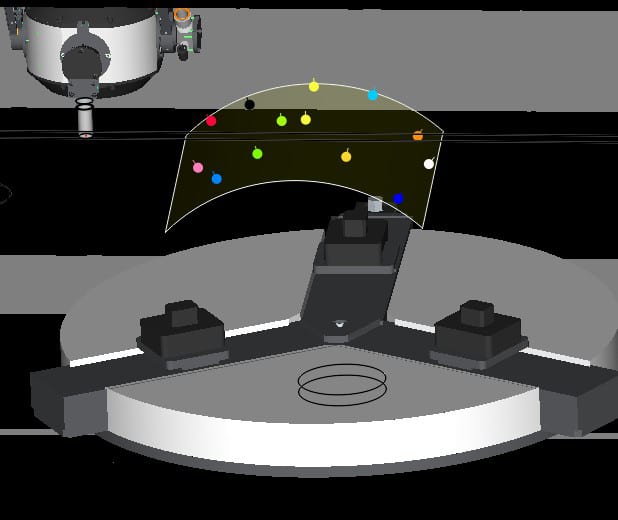
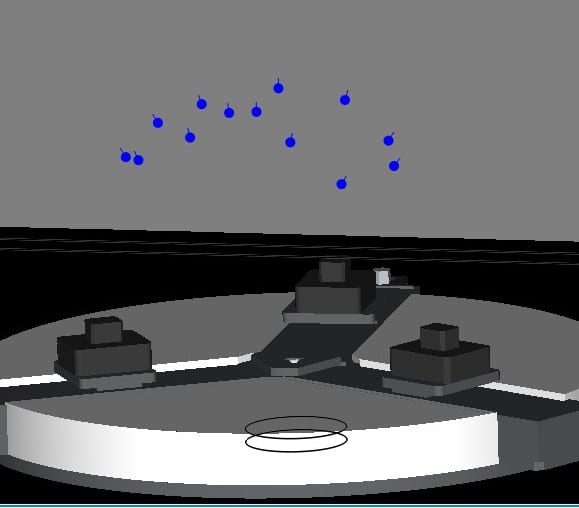
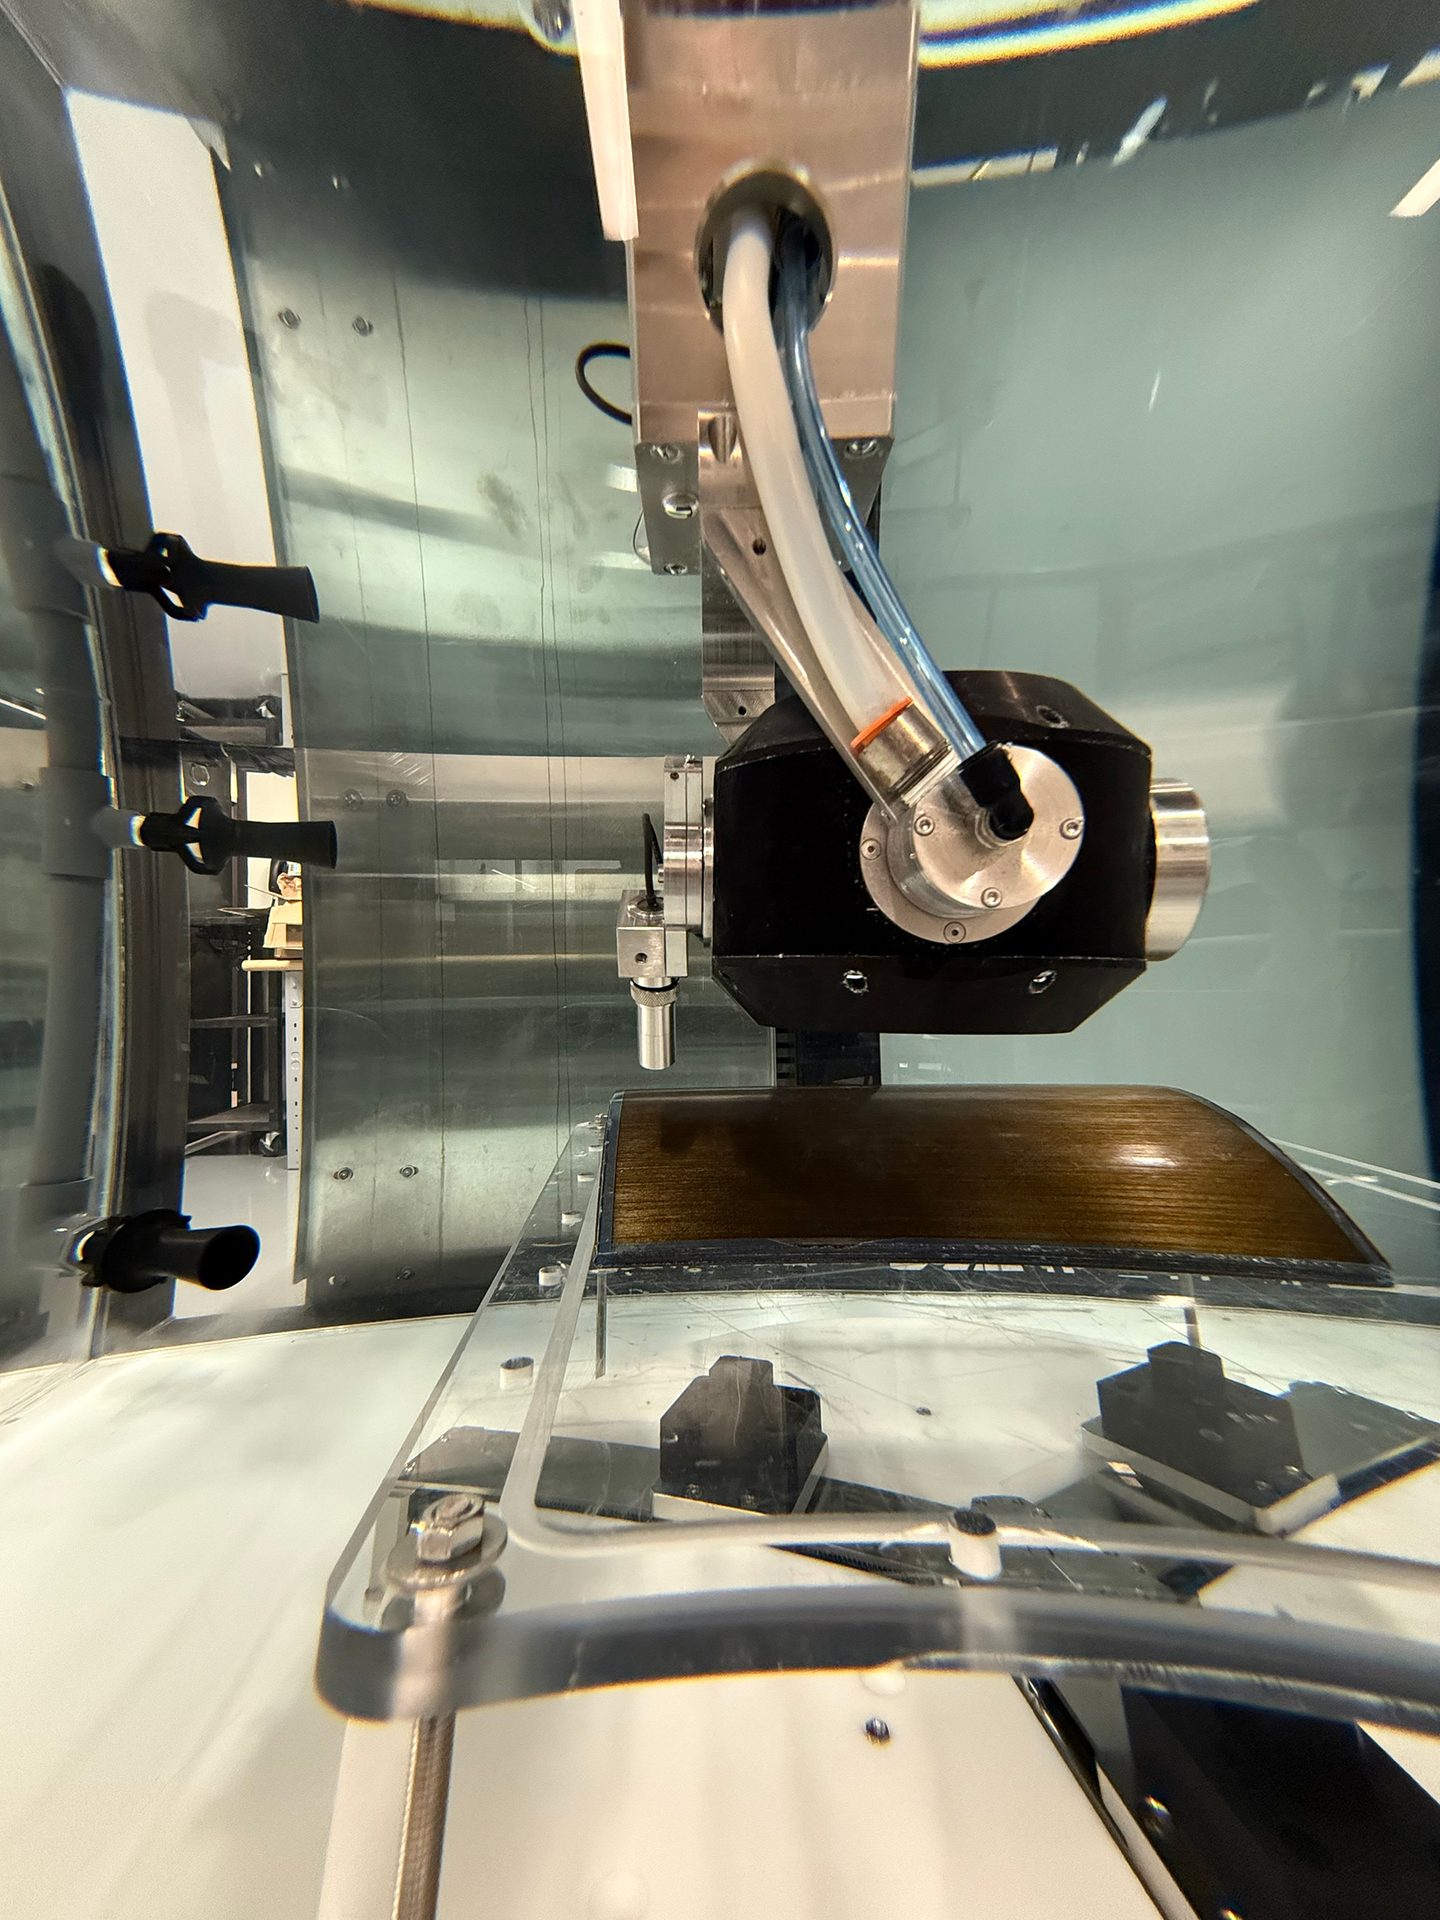
Fig.3 Positioning of a curved carbon composite part in the UT system
Subsequently, the 3D software performs interpolation and optimization of the digital surface, determining the appropriate path in accordance with the model’s curvature and aligning the component precisely with the computed CAD surfaces.
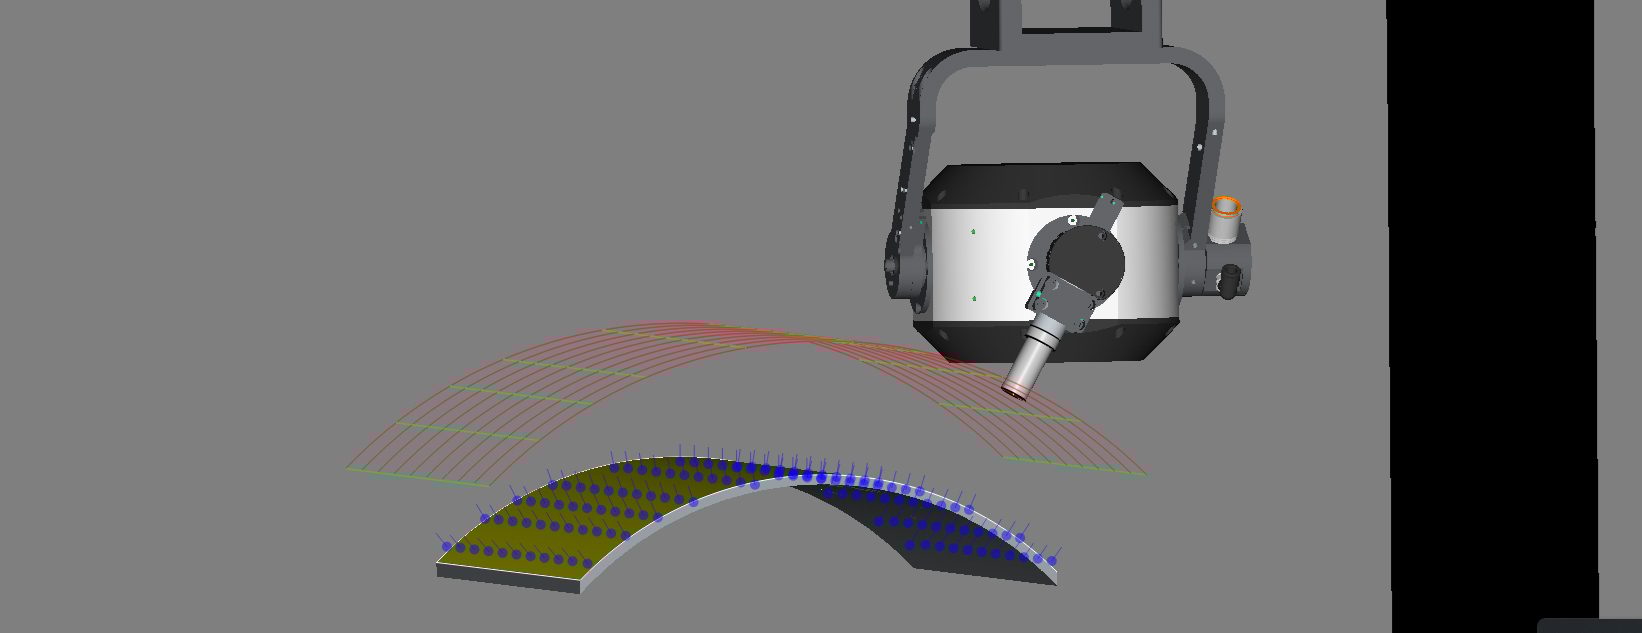
Fig.4 Carbon fiber curved plate scan paths after alignment with its CAD model
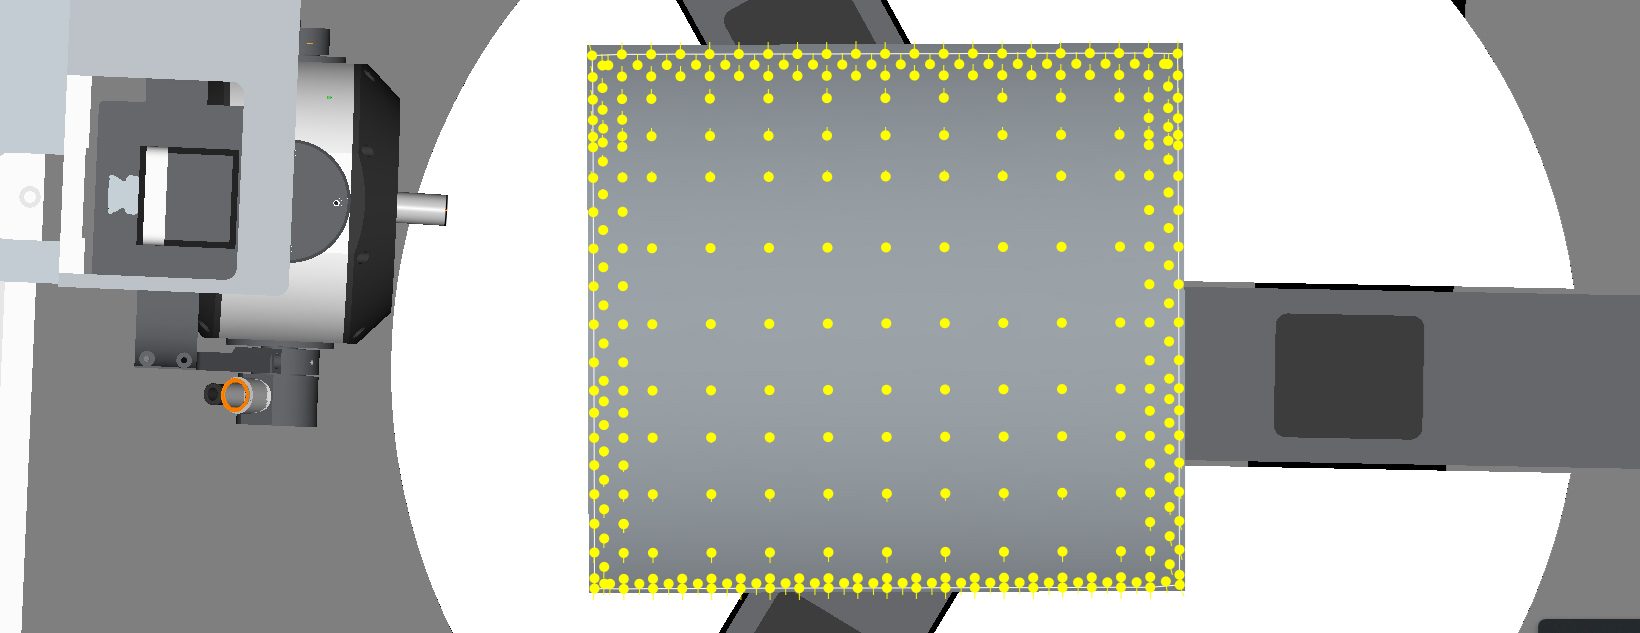
3. Adaptive Path Generation: If the CAD model from a preceding step does not accurately represent the actual part, signal losses may occur in regions where improper entry angles arise. To address localized or overall deviations from the nominal CAD geometry, the adaptive path generation process recalculates scan paths so that they precisely conform to the true contour of the inspected component. The procedure initiates with the automatic acquisition of reference points along a grid defined by the CAD file boundaries (as illustrated by the yellow dots in Fig. 5), each point being optimized automatically through probe angle adjustment; in the absence of a CAD file, this operation can also be performed manually.
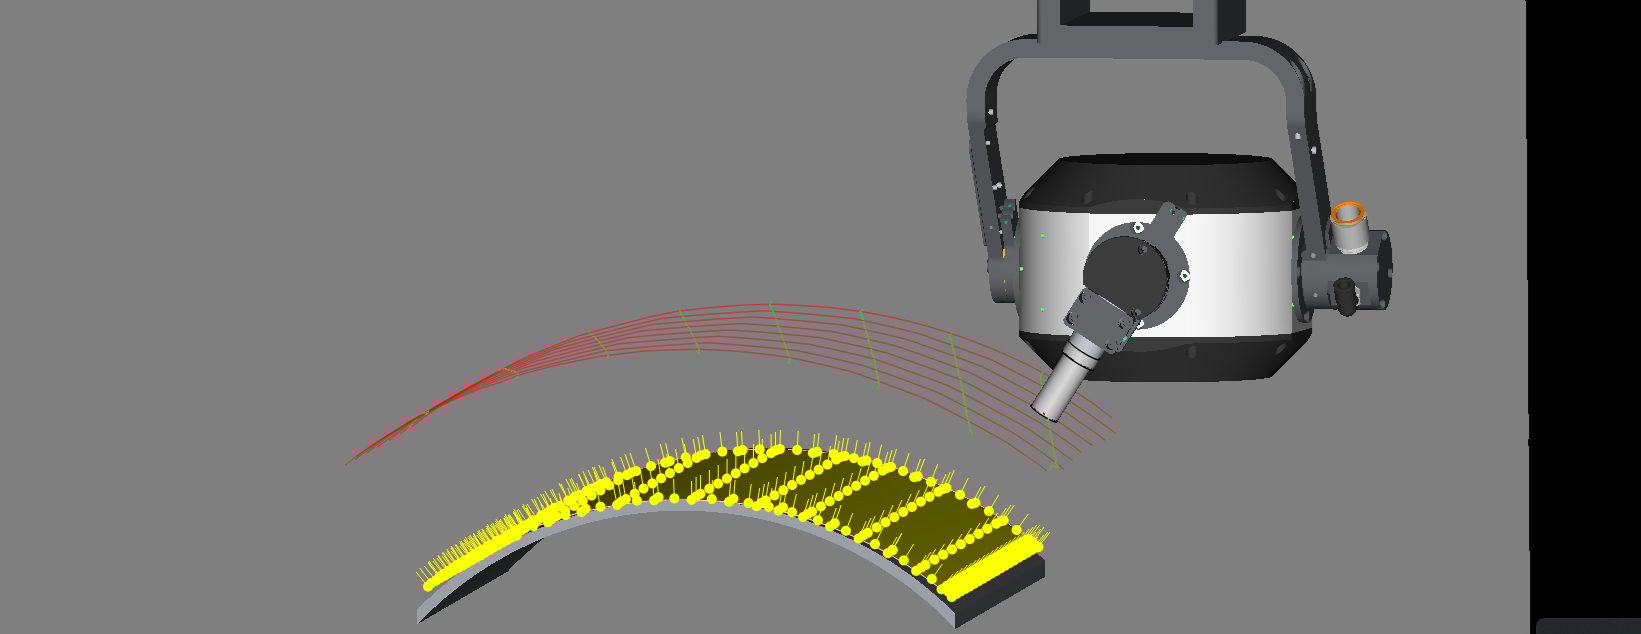
Fig.5 Reference point grid (above) and scan path (below) obtained for a carbon fiber curved plate using the Adaptative Scan Path tool
Based on the reference points data, the software reconstructs a continuous 3D surface path and computes a parametric representation of its curvature. It then interpolates between the measured points to generate smooth and accurate scanning trajectories that maintain both the desired probe angle and constant stand-off distance.
4. Validation and Correction: Before scanning, the calculated adaptive path can be simulated in the 3D software to visualize the scanner axes trajectories and to confirm scanning trajectories, probe angle and constant stand-off distance stability. During inspection, amplitude feedback can fine-tune gain and validate the probe beam alignment in real time.
Once the validation and correction steps are complete, the system proceeds to execute the scan, leveraging the optimized path to closely follow the true geometry of the inspected part. This approach not only ensures that the probe maintains the correct orientation and distance throughout the scan but also enables the collection of higher fidelity UT data, as any deviations or unexpected surface features are compensated for in advance. By integrating continuous feedback from validation process and the adaptive path recalibration, the scanning workflow enhances both the accuracy and reliability of the overall ultrasonic inspection process.
Performance Evaluation
A comparative assessment was carried out on aircraft samples: one constructed from fiberglass featuring honeycomb sections, and the other from carbon fiber reinforced polymers (CFRP). The initial scanning procedures utilized a water gantry system, while subsequent tests were conducted in an ultrasonic immersion tank. Both platforms incorporated 3D scanning capabilities and specialized control software to evaluate the effectiveness of the developed adaptive scan path algorithm.
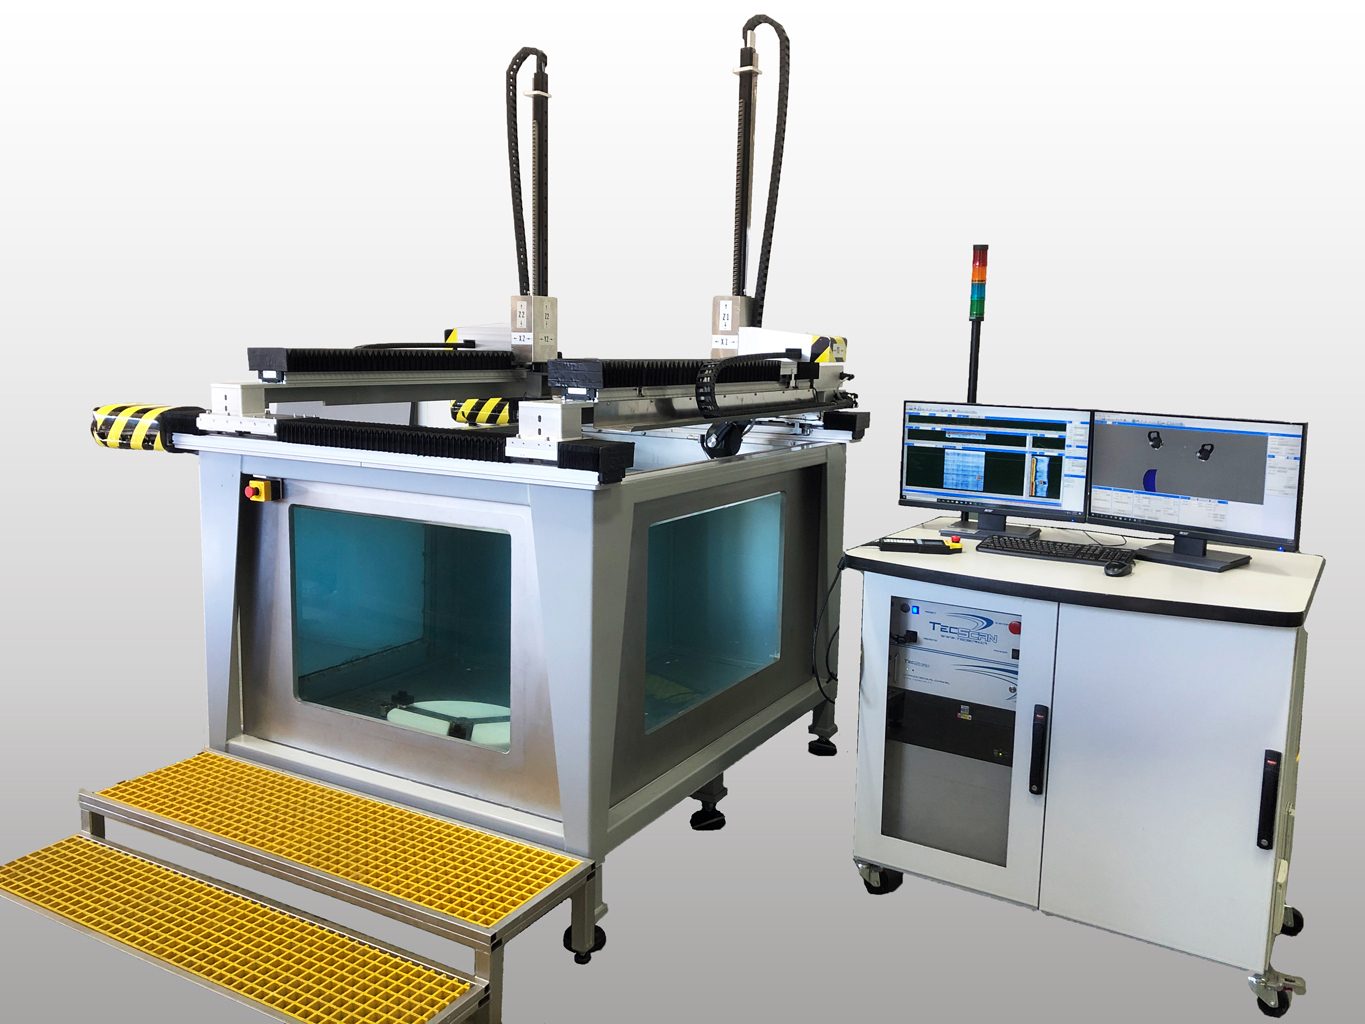
Fig. 6 Automated ultrasonic Gantry and immersion tank with 3D scanning capabilities and control software
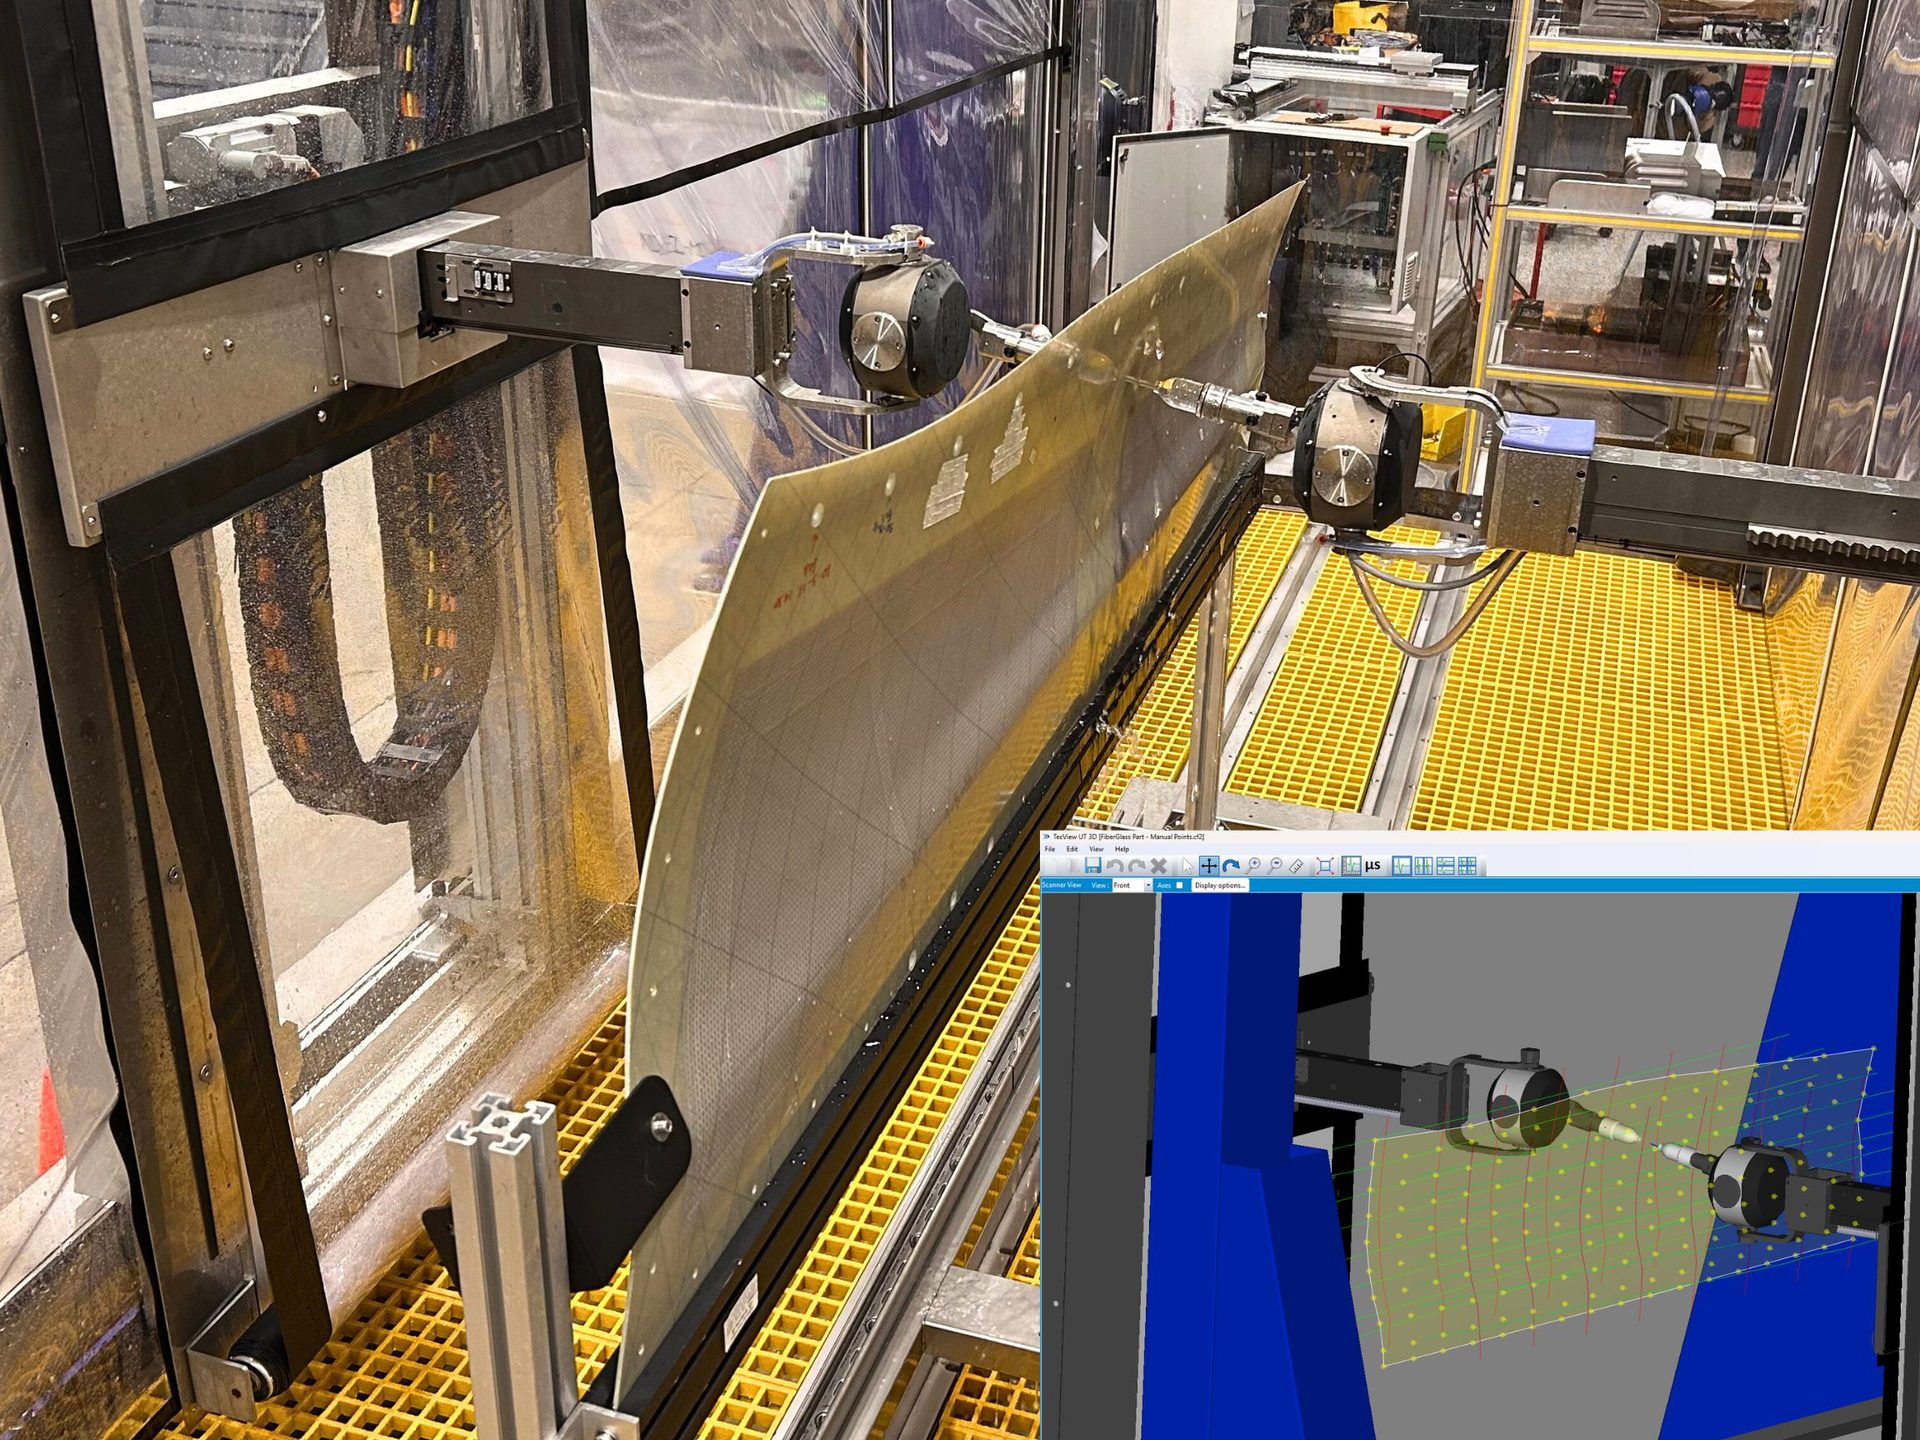
Figure 7 displays the C-Scan of the large fiberglass part featuring two honeycomb sections and multiple curvatures, scanned using the gantry system. As the CAD model was unavailable, the general geometry of the part was automatically mapped via a rapid surface-acquisition process, after which the adaptive scan path was employed for complete part scanning.
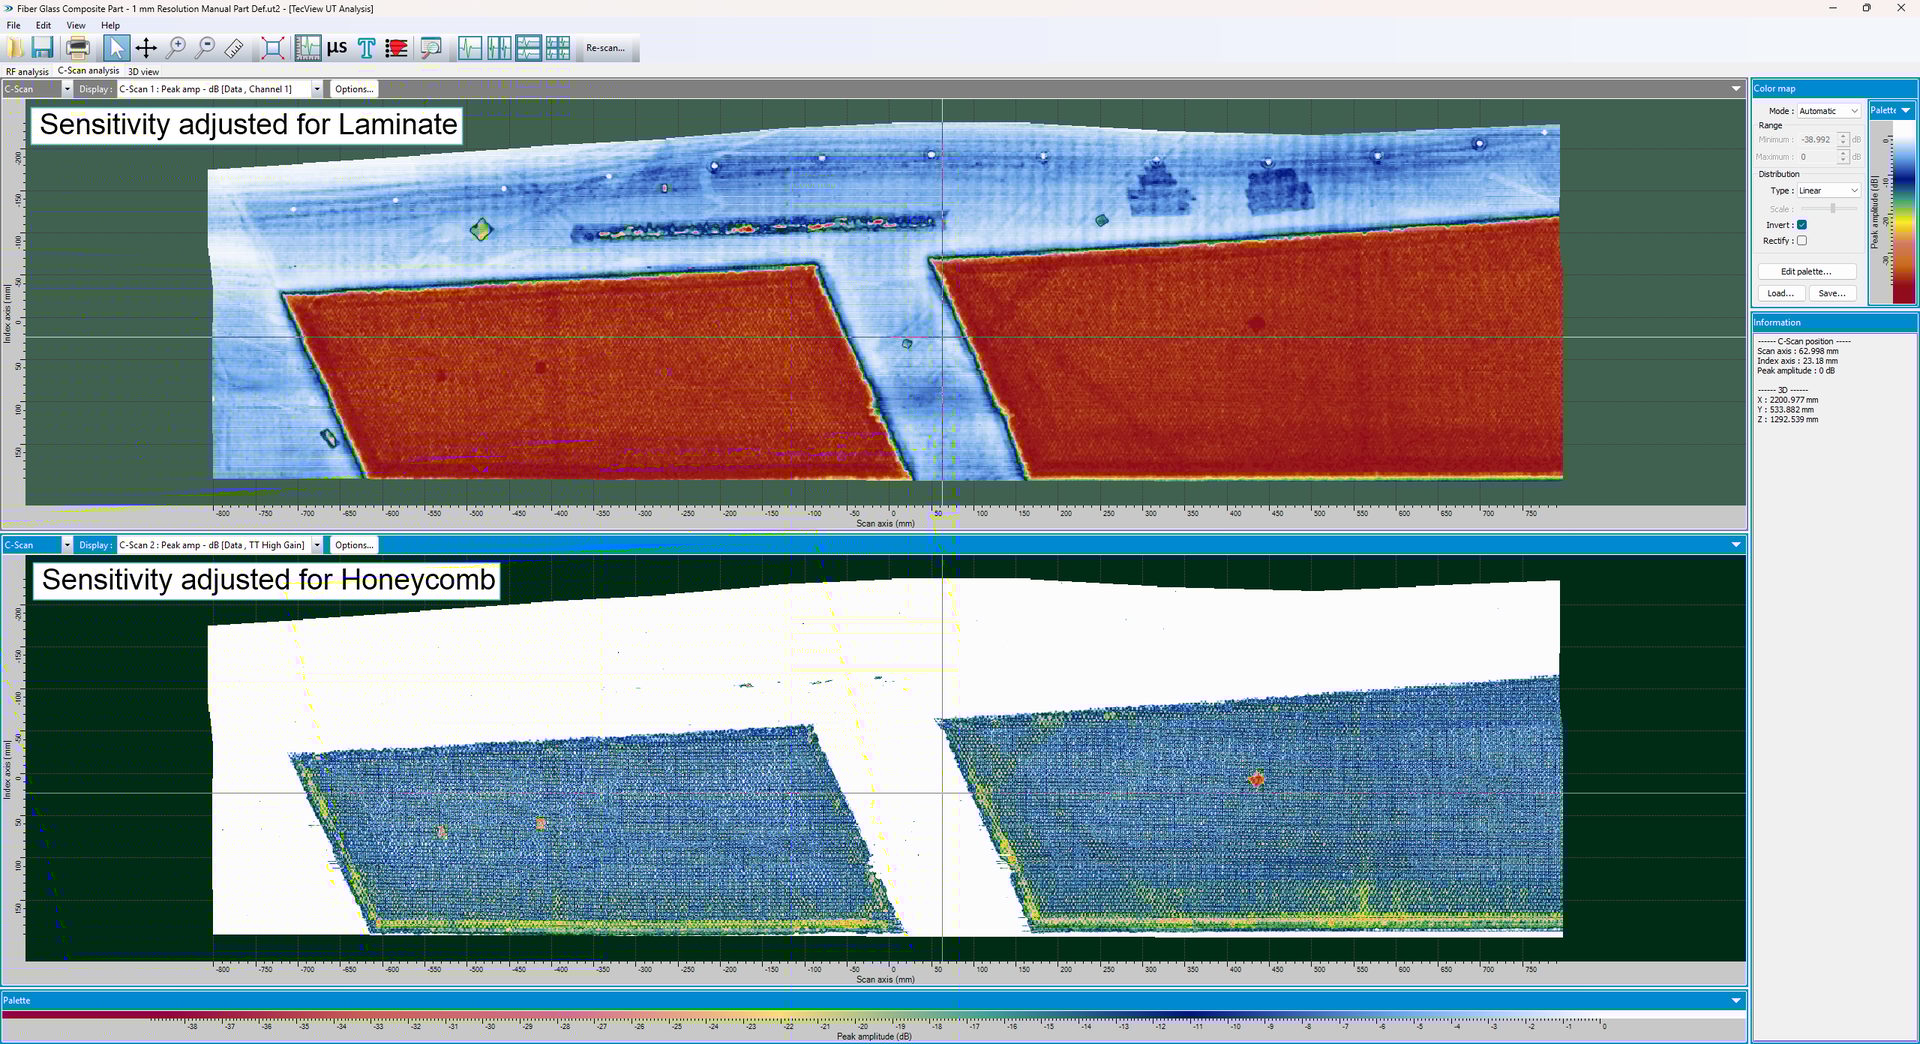
Fig.7. C-Scan of front wall signals of large composite component using surface-acquisition map
The obtained C-Scans are representations of the amplitude of signals transmitted through the part, collected from separate transmission channels, with sensitivity adjusted for both the laminate (top) and honeycomb (bottom) regions. Employing the adaptive scan path made it possible to scan this complex component while ensuring a consistent response across both laminate and honeycomb sections, a result unattainable with simple scan patterns.
The second series of tests were conducted on a curved composite part in an immersion tank using the 3D control software. Figure 8 presents the part C-Scan of the front wall signal for the first scenario, where trajectories were based on the imported CAD model of the part. In the C-Scan results, we can see the edge imperfections and overall deformation after curing, which caused deviations from the CAD model. Comparing front wall signal amplitudes between scans, a consistent amplitude along the C-Scan would be expected on such a smooth surface if the scan accurately follows it. However, the surface echo C-Scan obtained using the imported CAD-based trajectories shows a 23.18 dB variation for the top 95% of recorded amplitude values, indicating significant inconsistency.
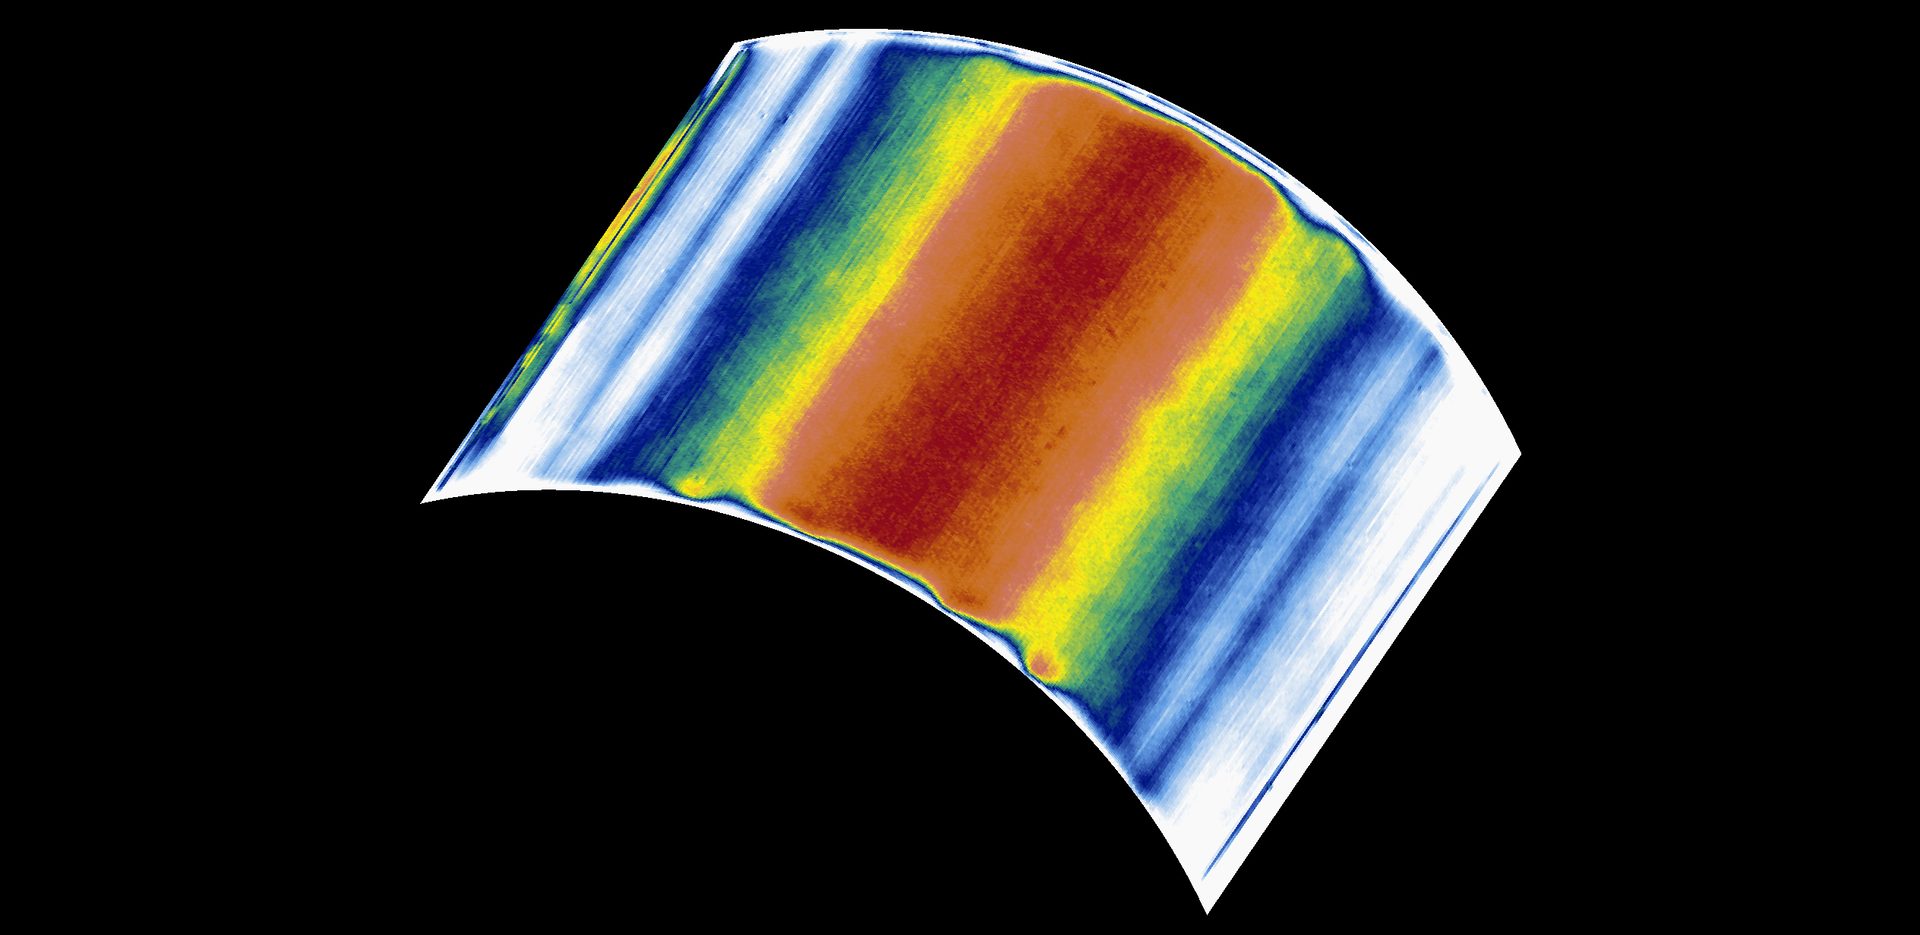
Fig.8. C-Scan of front wall signals of a curved composite component, obtained via CAD model scan path
Using the same ultrasonic parameters as pervious scan, the same part was later scanned utilizing the adaptive scan path algorithm. As illustrated in Figure 9, the C-scan data obtained after generating new paths showed improved front echo stability, with total variation measured at 1.86 dB among the top 95% of the highest amplitude values.
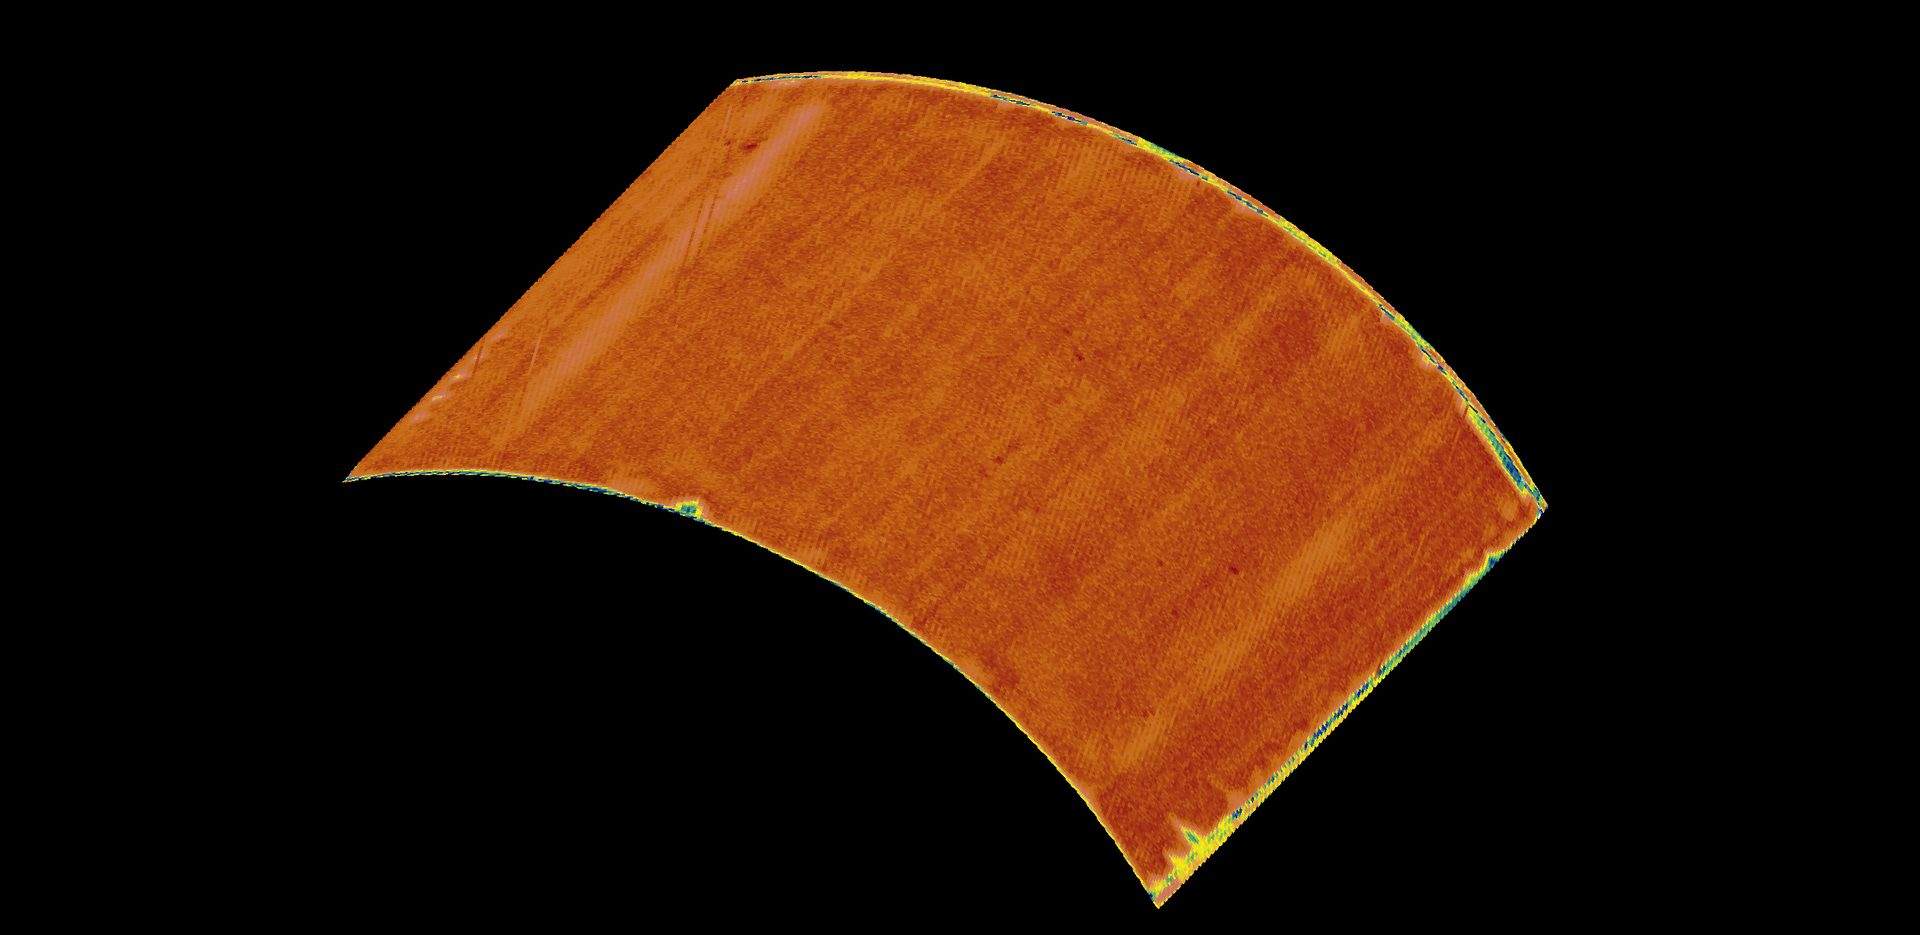
Fig.9. 3D representation of the amplitude C-Scan of the front wall signal of a curved composite part scanned using the scan path generated by the Adaptative Scan Path tool.
The results indicate that while the CAD-based scan path exhibits strong performance at the central region of the component, it experiences significant signal degradation towards the periphery. Conversely, the adaptive scan path demonstrates consistent amplitude across nearly the entire surface.
Maintaining a stable front surface echo amplitude is essential for effective inspection, as it reflects precise control over the ultrasonic beam entry angle. This aspect is especially critical when evaluating porosity in composite materials or detecting flaws based on amplitude within a material, since both processes are highly sensitive to uncontrolled variations in signal amplitude.
Conclusion
The presented adaptative scan path demonstrates a significant advancement in the versatility and reliability of automated ultrasonic inspection. By enabling users to define and adjust scan paths directly on the physical component, independent of CAD models, this solution effectively addresses discrepancies between design presumptions and actual conditions. This innovation improves data quality in complex areas, such as curved or irregular surfaces, and broadens the scope of automated NDT systems where reliable digital models are unavailable.
Technical Note: Path vs. Trajectory
In ultrasonic inspection: the term path describes the geometric route that the probe follows over the component surface. The trajectory, on the other hand, defines how the probe moves along that path, including its orientation, timing, and motion parameters.
In adaptive scanning: both are continuously adjusted, the path conforms to the actual surface shape, while the trajectory ensures the probe maintains the correct stand-off and angle at every point.
Images Source: TecScan Systems
Ahmad Chahbaz is the CEO of TecScan Systems. For more information, email achahbaz@tecscan.ca or visit www.tecscan.ca.
René Sicard is the R&D manager of TecScan Systems Inc. (Boucherville, Quebec, Canada). For more information, call (450) 641-5876, e-mail info@tecscan.ca or visit www.tecscan.ca.
LEARN MORE: