H2 Deck By Bold Name
h2 xxxxxx
H1 xxxxxx
h2 xxxxx

measurement
Key factors such as gloss, haze, distinctness of image, and orange peel work together to determine the overall total appearance, along with hidden variables that also control your outcome. By BYK-Gardner USA
Gloss, Haze, and the Hidden Variables:
A Guide to Understanding Surface Appearance
measurement
H2 Deck Info By Paragraph Style Bold
Headline
A customer’s first impression of a product is usually based on appearance rather than performance. Even when performance is excellent, problems in formulation, application, or processing can leave visible surface defects that reduce perceived quality. Key factors such as gloss, haze, distinctness of image (DOI), and orange peel work together to determine the overall total appearance. However, there are hidden variables that also control your outcome. These factors come together, ultimately influencing customer satisfaction, making consistent measurement and control essential. The understanding of the key factors of appearance, as well as the hidden variables, is essential to overall product quality.
Caption
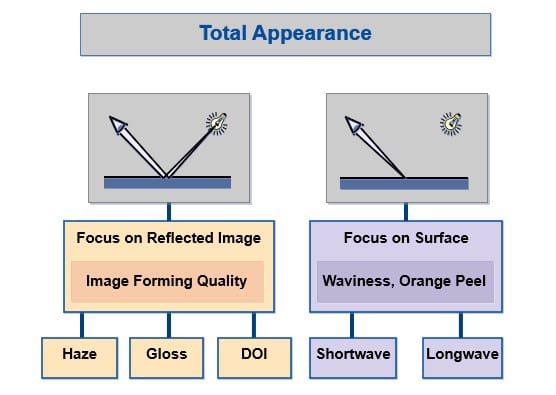
Surface Appearance:
To guarantee good quality assurance, it is necessary to define appearance with objective, measurable criteria. We evaluate a surface by how it reflects light and the quality of the reflected image. The surface can appear brilliant or dull (gloss). When there is additional light scatter this quantifies (haze) and when focusing on the quality of the reflected image this determines the distinctness of the image (DOI). When focusing on the surface, we gain additional information about the structure’s size and form. We see these structures as a wavy pattern of light and dark areas. This waviness is often referred to as orange peel. These key factors work together to create the overall perception or the “Total Appearance” of the surface.
Caption
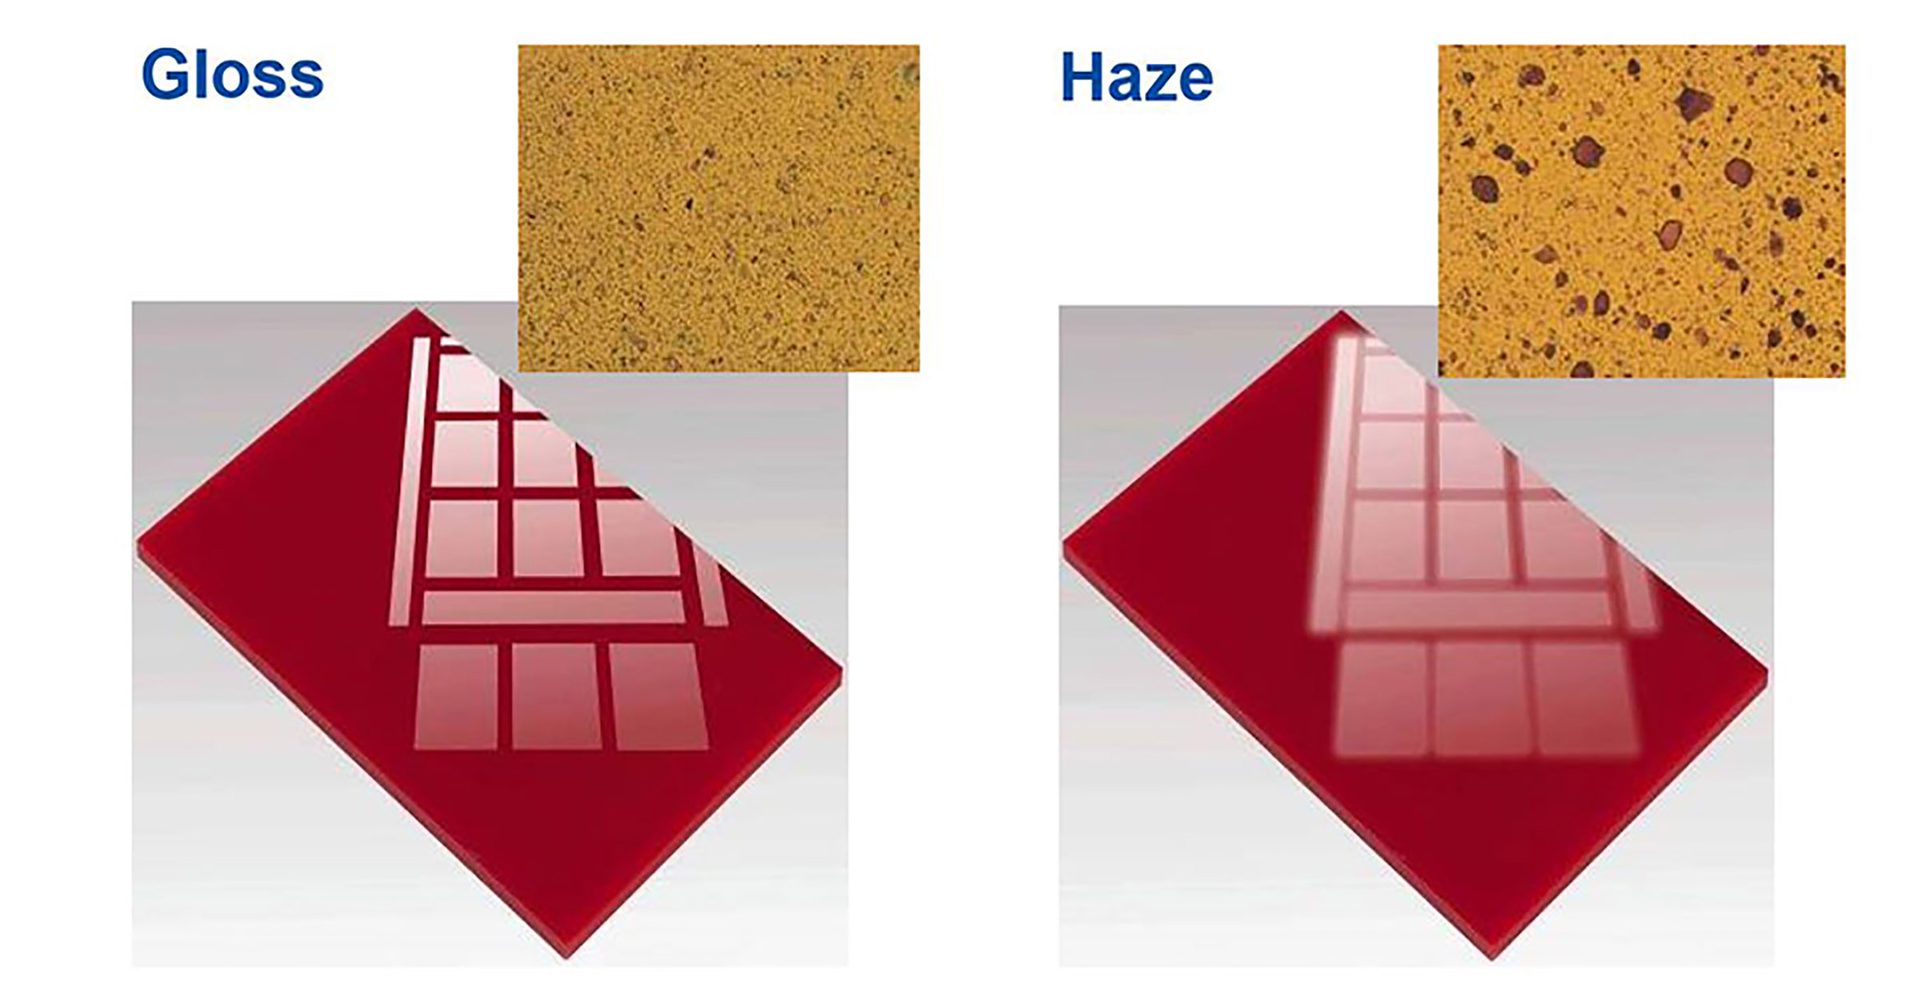
Gloss
Gloss is the measure of how much light a surface reflects at a specific angle, which determines how shiny or reflective it appears.
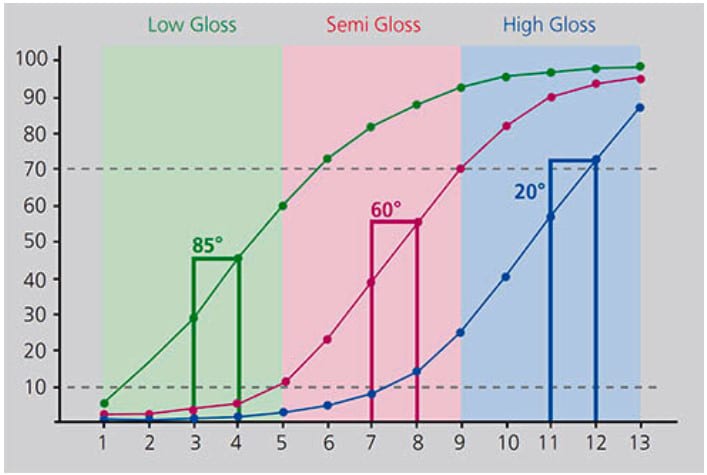
Gloss measurements are recorded as a value of gloss units (GU) or reflectivity (%R). The GU scale traditionally goes from 0-100 GU based on a specialized black glass standard, with a refractive index of 1.567 being the standard at 100 GU. With gloss measurement, different angles correlate better to different surface finishes; therefore, it’s essential to follow guidelines set by international standards when determining testing conditions.
The 60° illumination is used as a general geometry for a wide range of applications with gloss values between 10 and 70 gloss units. If gloss data is higher than 70 GU or lower than 10 GU, this measurement geometry is no longer effective in showing differences as shown by the flat portion of the curve (see figure below). Thus, the 60° geometry would show little or no difference in this range, while visually there is a clear difference.
Caption
Haze
Reflection haze is the additional scattering of light that reduces clarity or sharpness of the surface.
As light interacts with the surface or coating, it can scatter resulting in a milky effect and increase haze. This effect can stem from a variety of factors, ranging from formulation to application, resulting in reduced perceived quality of the final product. The reflection haze or DOI can be measured to quantify the quality of the reflected image. The measurement principle of these instruments is to quantify the sharpness of the reflective image correlating to our visual impression of the surface quality.
The Challenge of Visual Assessment
In many industries, product appearance is both a measure of quality and a matter of subjectivity. Quality reflects how a customer or end user perceives the value or condition of a product, while subjectivity reflects the nature of visual assessments used in testing. Although human perception remains the “gold standard,” this subjectivity can affect reliability and repeatability in quality control, even among experienced professionals.
This variability can cause issues, for example, two adjacent auto body panels painted the same color but appeared different in texture, gloss, or clarity. Factors like waviness, fuzziness, or changes in brilliance may go unnoticed or be inconsistently reported, depending on who performs the inspection. Visually breaking down these effects into quantitative results is complex, since visual assessments alone are difficult to standardize. It is important to understand how to interpret visual effects numerically.

Hidden Variables that Affect Appearance
- Refractive index – It’s possible to have two samples that visually appear to have the same high gloss and brilliance, yet they measure differently due to the different refractive indexes of the coatings.
- Curved surfaces are problematic because light reflects at different angles of the curved surface and cannot be repeated without a fixture or robot.
- Environment, Materials, Application methods – Temperature, humidity, and lighting can affect how gloss, color, and surface texture are perceived. The material or substrate type and coating formulation affect how the finish levels, hides, or reflects light. Application methods also affect variability, influencing film thickness, surface uniformity, and the presence of defects like orange peel, runs, or overspray.
- Distance affects the types and extent of severity of defects that can be detected and the overall perception of appearance. Consistency in inspection distance is crucial; changes introduce variability in the results.
- Resolution of the human eye limits the ability to distinguish fine surface features, defects, and variations in gloss or texture. Defects smaller than 0.1mm at close distances may not be visible to the naked eye and can only be reliably identified with measurement instruments.
Considering the Use of Visual Approaches?
Traditional appearance assessments rely on visual inspections performed by trained staff with the requirement of standardization of viewing procedures, light booths, reference panels, or rating scales.
- Pros: Fast, requires no special tools, and aligns with the gold standard being a true human’s perception.
- Cons: Subjectivity and inconsistency between people. It’s also easily influenced by environmental factors and conditions like lighting, angle, mood and fatigue.
The cons make it difficult to replicate, document and most importantly, quantify the differences that are perceived while defending any discrepancies over end product satisfaction. This leads to a definitive need for a reliable, repeatable method that can deliver objective data, not just opinions.
Consider using Instrumental Approaches
The introduction of objective measurement equipment fills the need to quantify appearance quality and ensure reproducibility between suppliers and plants. Gloss meters are used to quantify the gloss appearance of a surface as it relates to our visual impression with standardized angles at 20 °, 60 °, 85 ° for most applications. Specialized 45 ° and 75 ° angles are used for ceramics, paper and textured products like vinyl siding.
Reflection haze meters measure the scattering behavior of the topcoat, while DOI meters assess the sharpness of the reflected image. Orange peel instruments capture the reflected energy from the surface, providing a direct evaluation of surface smoothness and orange peel texture. These objective measurement methods eliminate traditional subjectivity and promote data-driven decisions that lead to fewer reworks, batch inconsistencies, and customer rejects. Once implemented, data can be compared and shared digitally between suppliers and sites for efficient reporting, communication, and early detection to avoid costly mistakes.
Conclusion
Surface appearance is more than aesthetic; it defines perceived quality. Attributes like gloss, haze, DOI, and orange peel can be quantified with tools that can measure and define the appearance of a surface. The main goal is to ultimately measure what you see to reduce subjectivity and set defined methods and standards in place for consistent testing and quality assurance. With objective assessments, companies can improve product consistency, reduce waste, and ensure positive brand reputation. Quality isn’t just built into a product, it’s seen and judged based on every appearance attribute.