xxxxxx xx
xxxxxxxxxx
Back to Basics
NDT
NDT

Fatigue testing is a well-known technique to help predict the long-term performance of materials. By Christopher Macey
Gigacycle Fatigue Testing of Metals
Using Ultrasonic Resonance
Metal components used in important applications in aerospace, automotive and medical devices require both high performance and extremely long lifetimes to be utilized safely.
Fatigue testing is a well-known technique to help predict the long-term performance of materials. In fatigue testing, samples are subjected to periodic stresses at various forces below their yield strength to generate plots of the applied stress versus the number of cycles to failure (S/N plot).
Standard Hydraulic Fatigue Testing
The designs of typical uniaxial fatigue testing rigs employ servo-hydraulic or electro-mechanical actuators to generate cyclic stresses and load cells to measure the force applied to the samples during testing. Figure 1 shows a typical hydraulically actuated fatigue test system and a schematic outlining its components. Test procedures utilizing such designs are well documented in ASTM publications such as E466-1 and E606, which describe force-controlled and strain-controlled measurements, respectively.
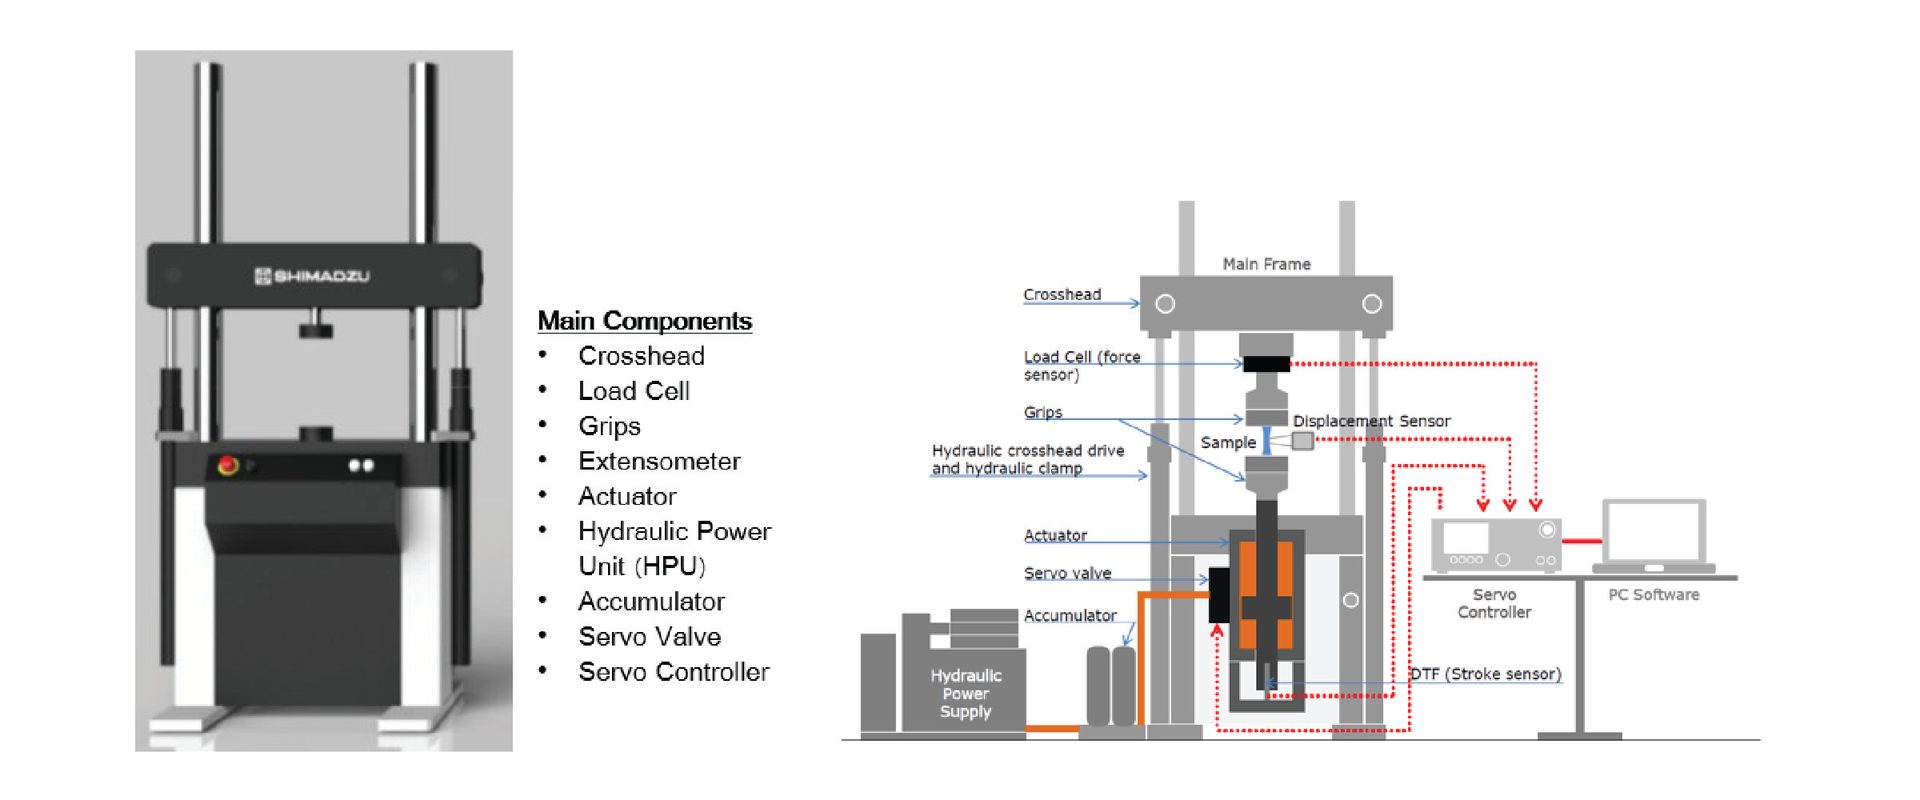
Figure 1: Typical fatigue testing configuration
These common hydraulic or electrostatically actuated designs typically produce maximum cycle frequencies well under 100Hz. This practical maximum frequency limits the readily achievable total number of test cycles to about 107, which can take several days to achieve. Alternatively, fatigue testing based on ultrasonic sample resonance enables testing at 20kHz.
Ultrasonic Fatigue Testing
Fatigue testing at 20kHz cycle frequency has significant advantages. It enables more rapid sample screening and testing in the gigacycle regime in a reasonable timeframe when compared to standard lower frequency testing.
Figure 2 shows the relative speed advantage of testing at 20kHz as compared to standard cycle frequencies.
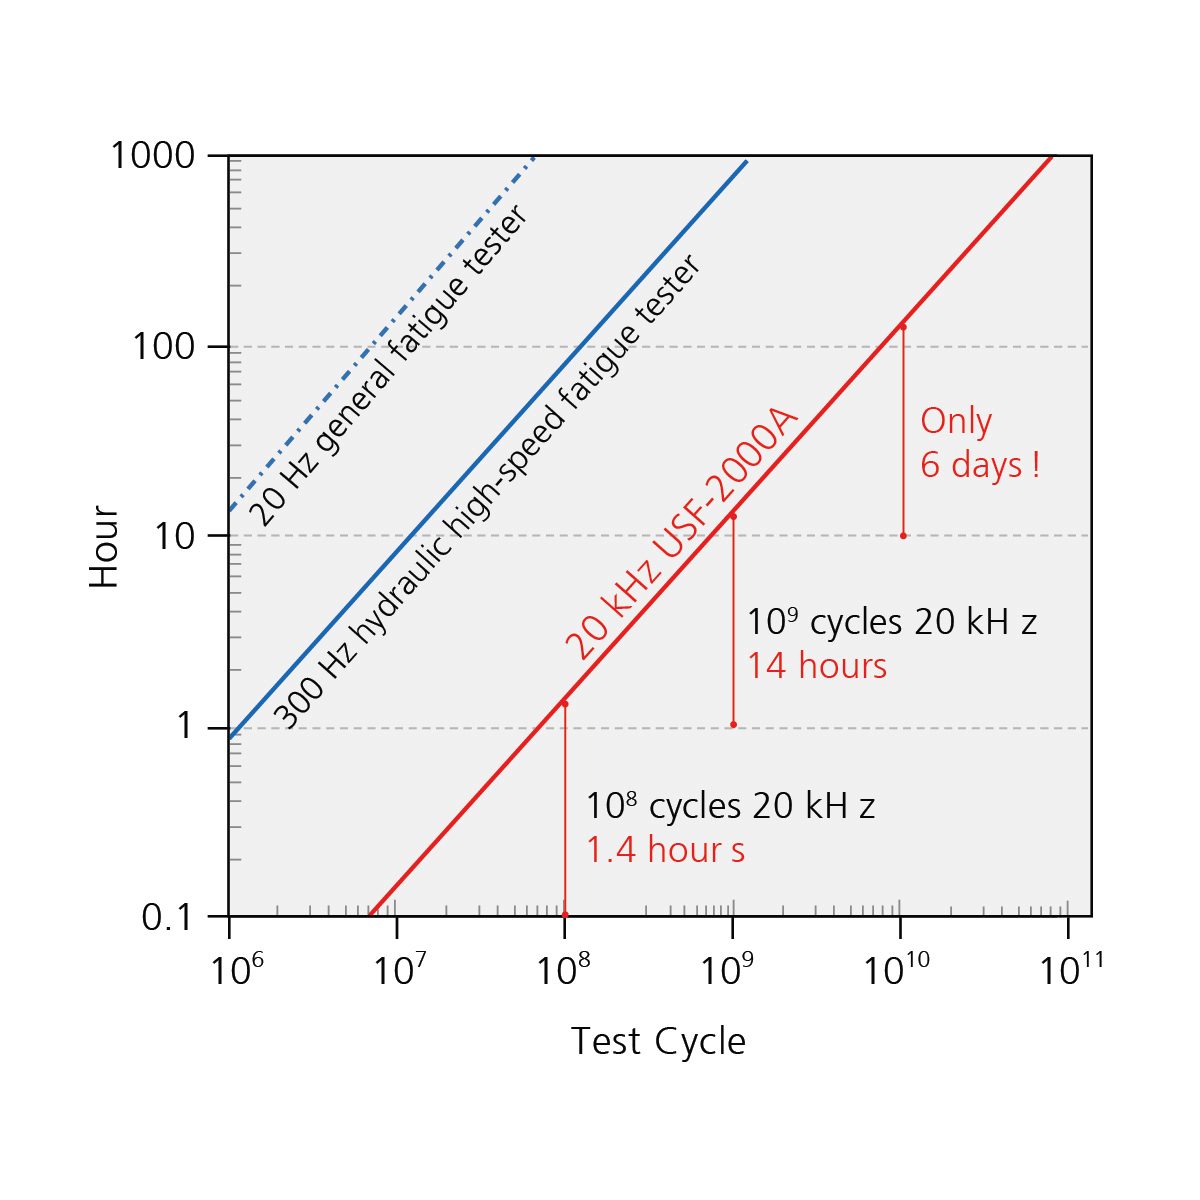
Figure 2: Comparison of testing time based on frequencies
Figure 3 shows a commercially available ultrasonic fatigue system and constituent components. The system is comprised of a 20kHz piezoelectric oscillator connected to an amplifying horn which transmits an expanded displacement to the sample. One end of the specimen is connected to the amplifying horn. The other end of the sample is free to oscillate.
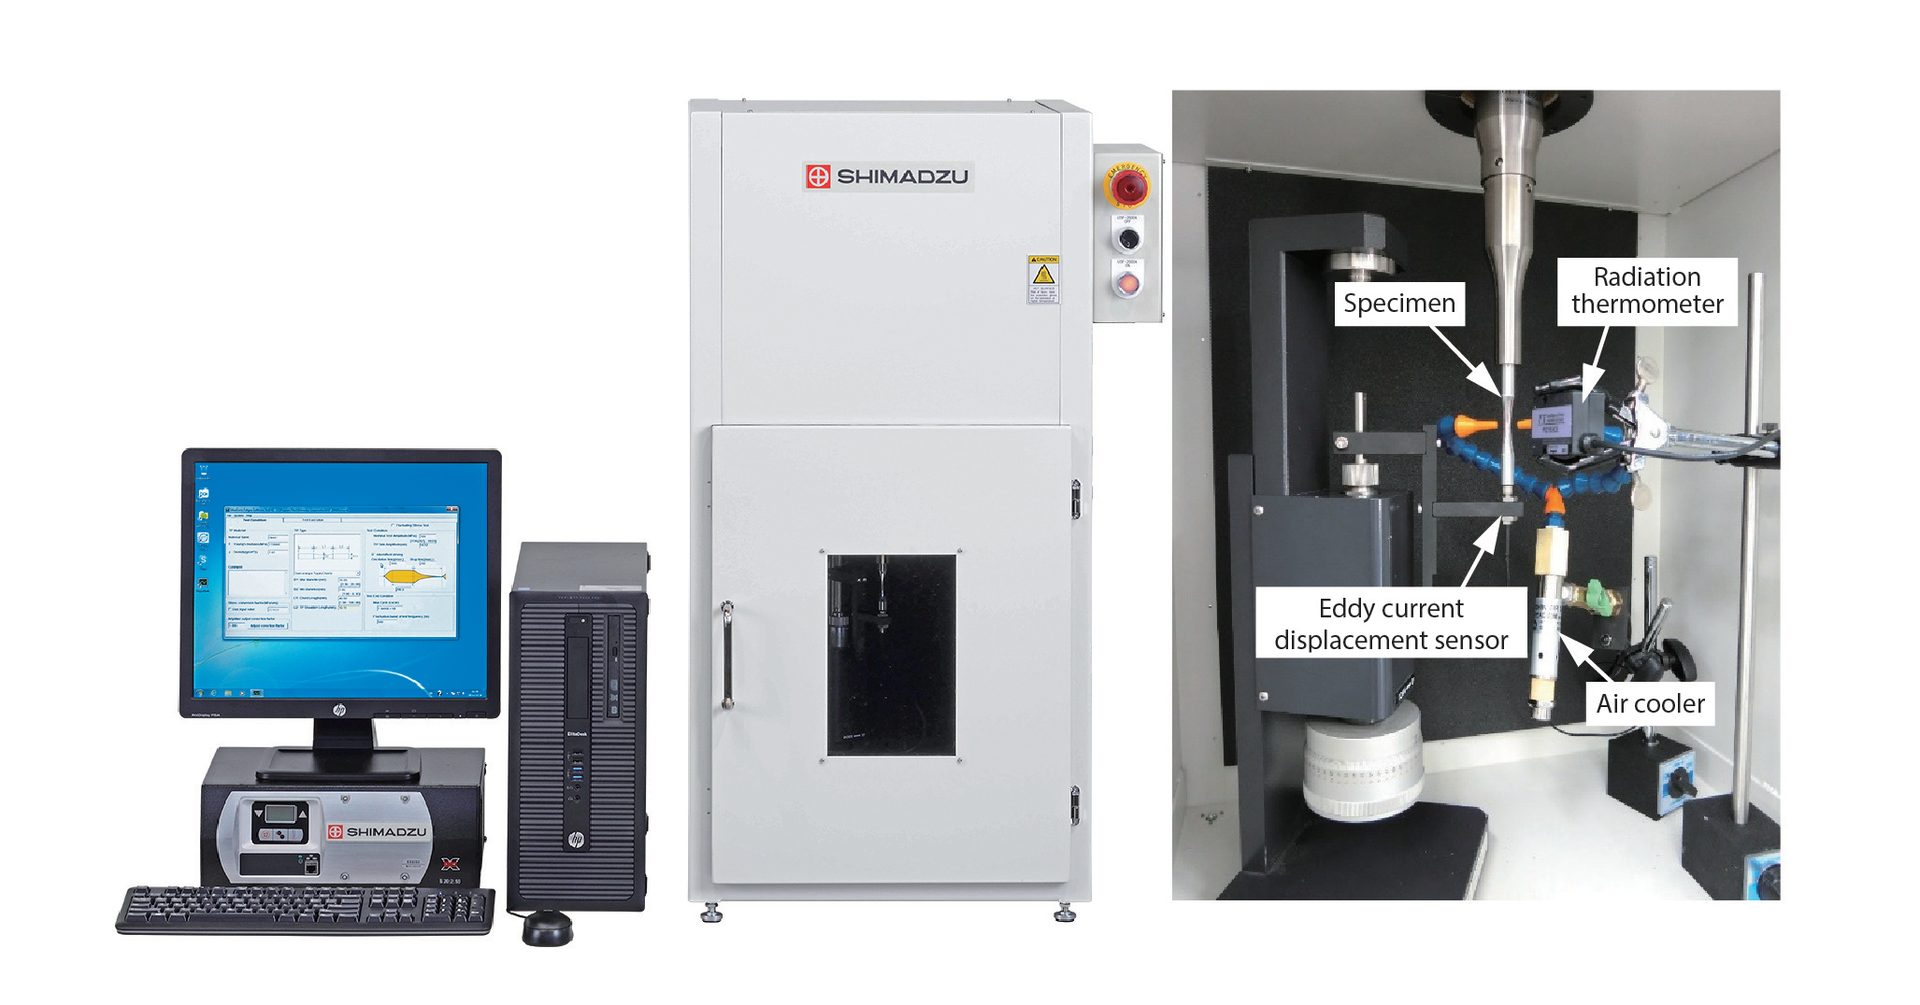
Figure 3: Ultrasonic fatigue system and constituent components
During testing the sample expands and contracts in resonance with the oscillator. For a resonating sample the maximum displacement occurs at the sample end, while maximum stress is applied at the midpoint of the sample as shown in figure 4.
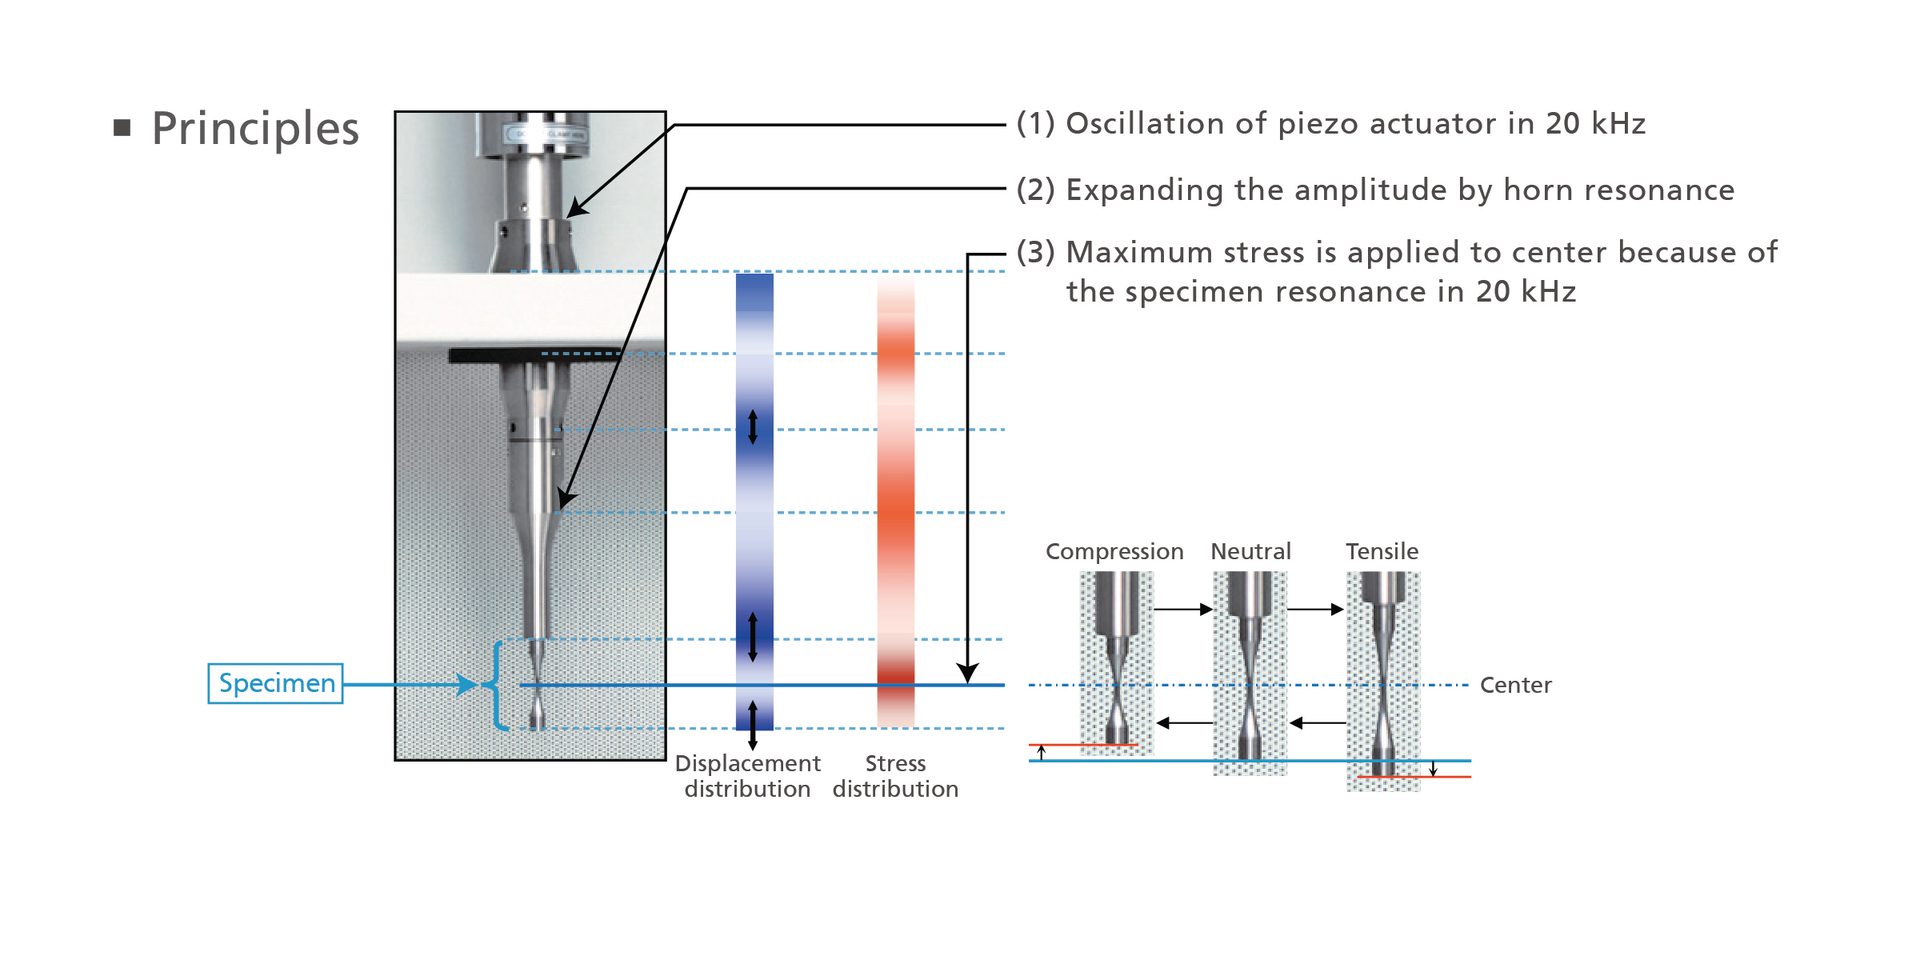
Figure 4: Principle of ultrasonic fatigue system
The displacement of the free end of the sample is varied by the power input to the piezoelectric oscillator. During calibration the sample displacement at several power levels is measured directly using a noncontact eddy current displacement sensor.
Unlike standard fatigue testing, the load applied to the sample is not measured directly. The system software allows the stress to be calculated using the sample displacement and Young’s modulus. The number of cycles is calculated from the test time and oscillation frequency (20kHz).
Applicable Materials and System Operation
Only materials that can resonate at 20kHz without excessive heating are measurable using this technique. To reduce sample heating during testing, a forced-air cooling mechanism is provided, as shown in figure 5. In addition, the system provides for computer-controlled intermittent operation. This allows the system oscillations to be continuously stopped and restarted to allow the sample to cool. If intermittent operation is employed, an initial calibration is performed to determine the ramp-up time required for the system to reach 20kHz. The system software compensates for this ramp-up time when calculating the total cycle count. Sample temperature may be monitored during testing using a radiative temperature measurement device.
The system software enables the sample length required for resonance at 20kHz to be easily calculated for tapered cylindrical, rod and notched samples using inputs of the specimen density and Young’s modulus.
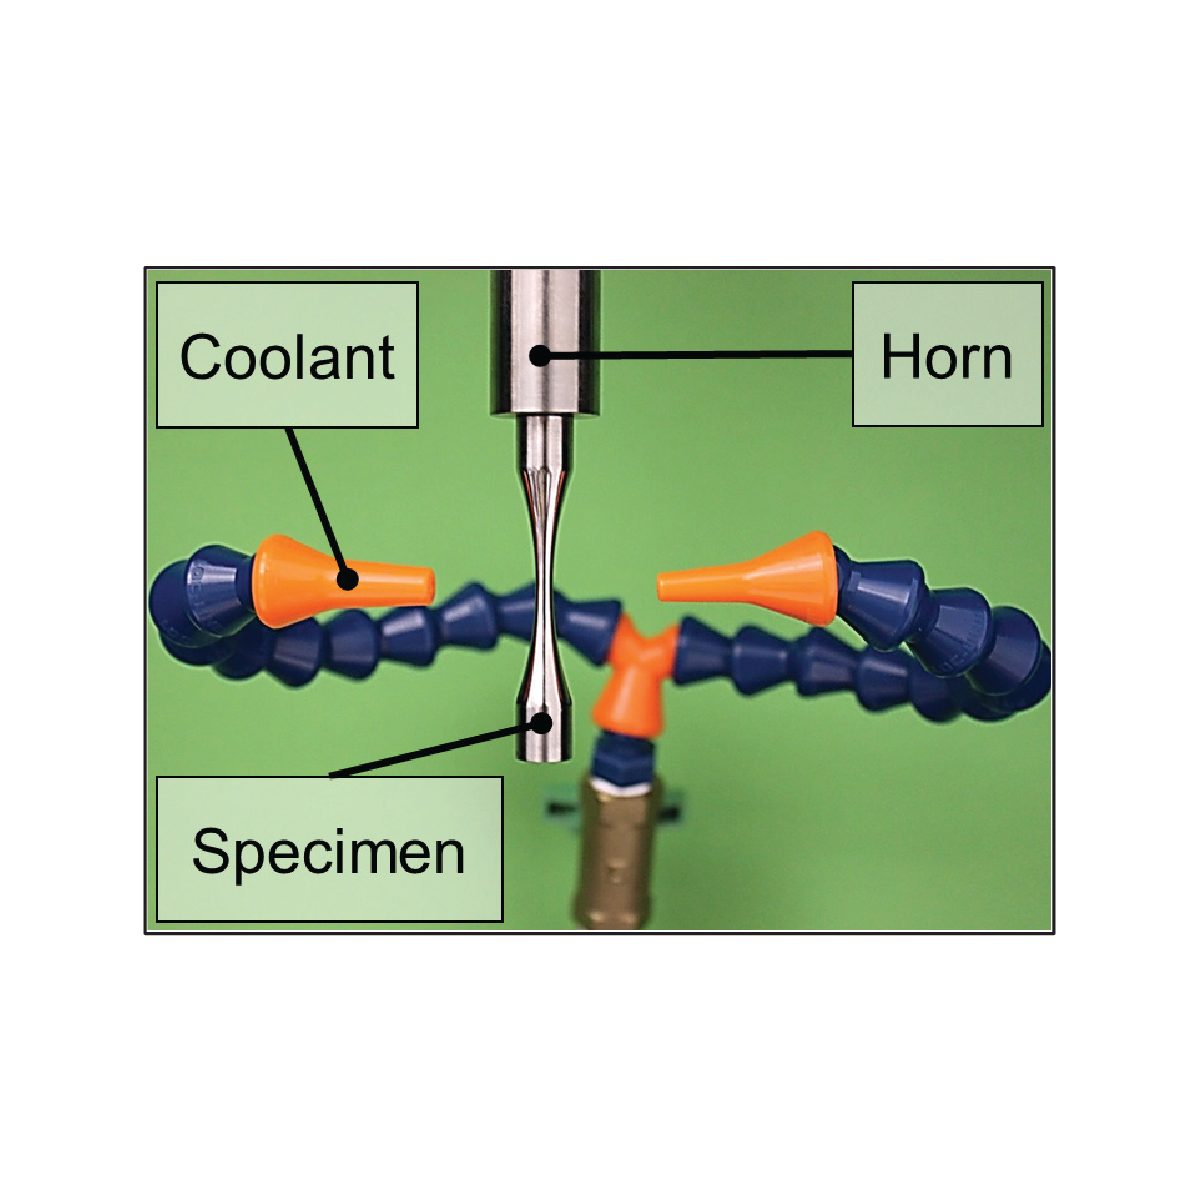
Figure 5
A more detailed introduction to the theory and basic practice of ultrasonic fatigue testing may be found in the ASM handbook published in 20001. While the principles of ultrasonic fatigue are well established, the U.S.-based ASTM E08 committee has only recently established a working group to develop a best practices guide2. In Japan, however, the Japanese Welding Engineering Society has published a standard test method which provides complete procedural details for repeatable ultrasonic fatigue testing of metals at room temperature in 2017 (WES 1112:2017)3.
Application Example
The following study conducted by F. Yano of the Shimadzu Corporation Global Applications Development Laboratory illustrates the technique as applied to metal samples at room temperature.
SNCM439 and A6063 T5 high strength metal alloy samples were tested following WES 1112:2017 standard procedures using an ultrasonic fatigue testing system4.
Figure 6 shows the SNCM439 showing the specimen design. The software enables calculation of the correct sample length for resonance at 20kHz. Figure 7 shows the relationship between sample length and resonant frequency.
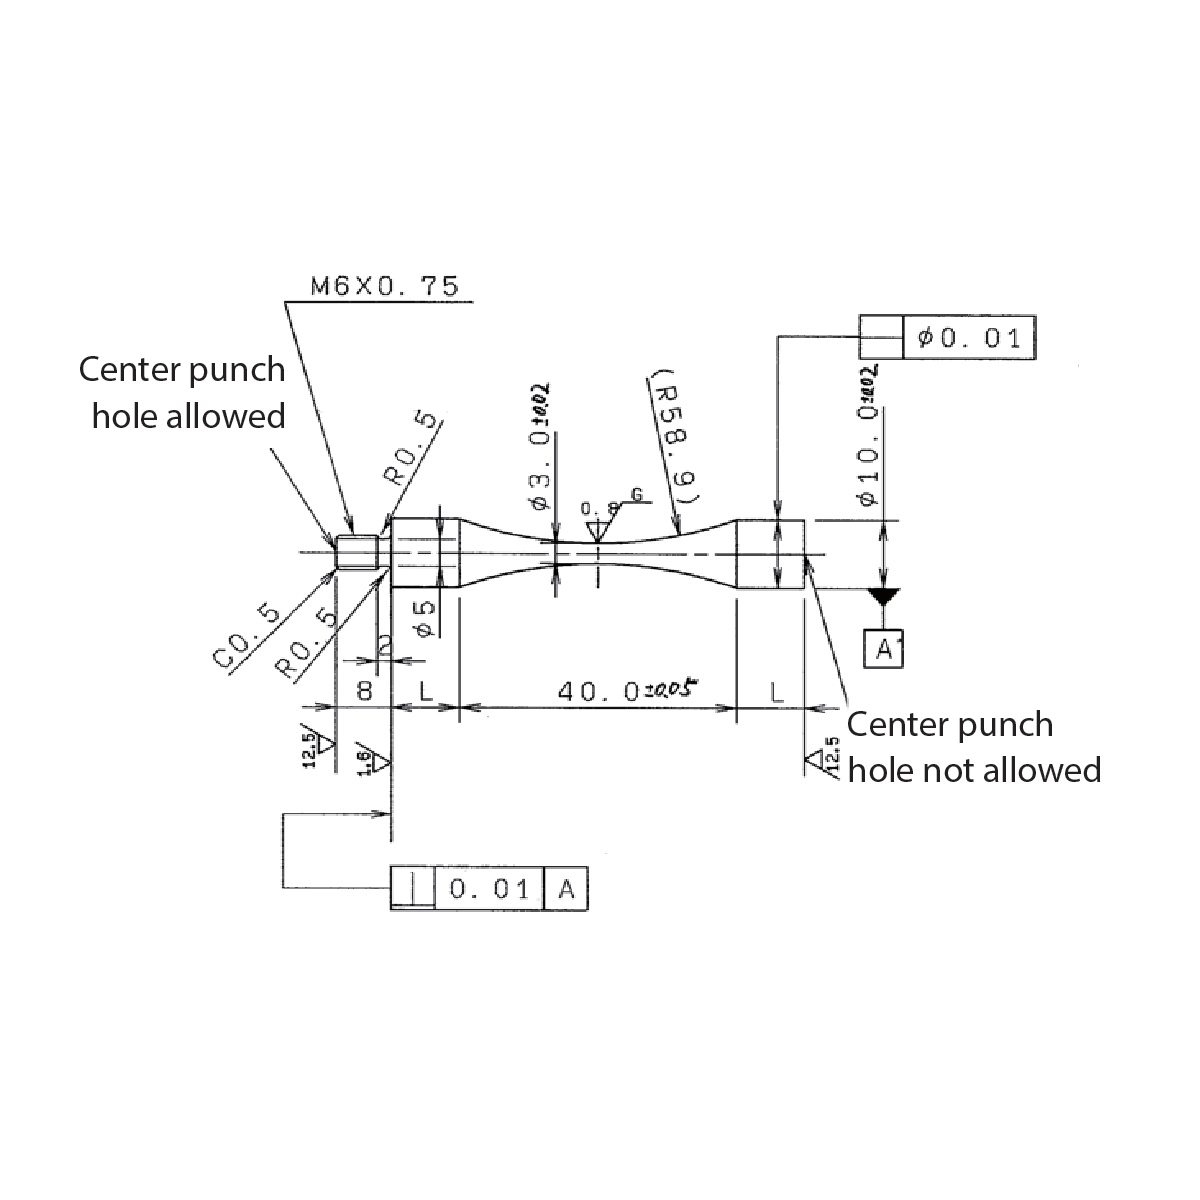
Figure 6: SNCM439 Specimen drawing
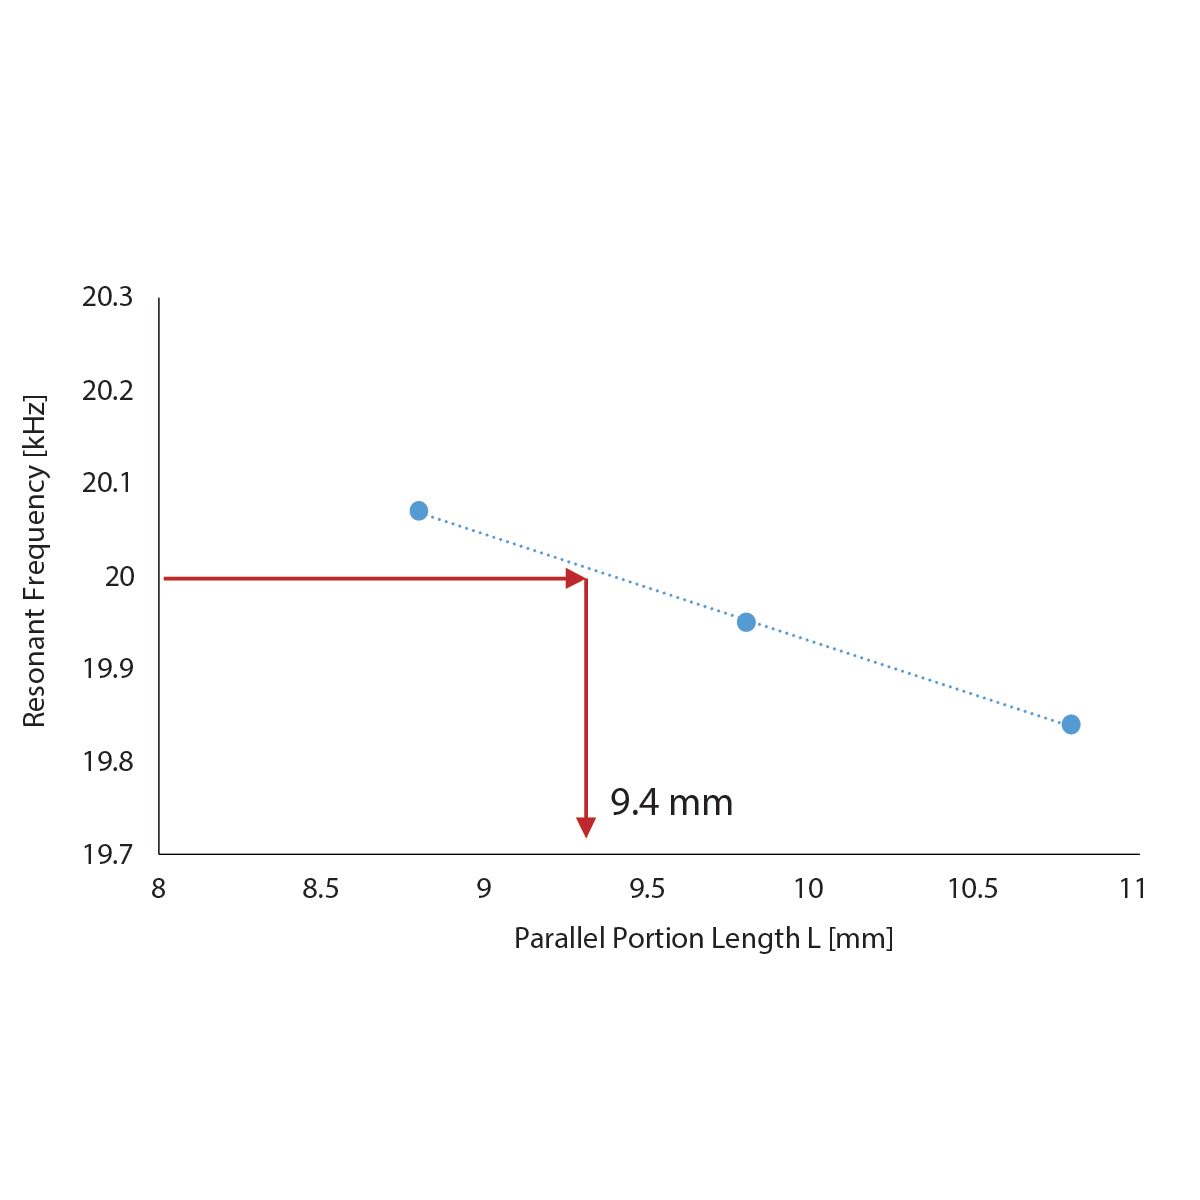
Figure 7: Relationship between length of parallel section and resonant frequency.
The SNCM439 and A6063 T5 samples were tested at six different stress amplitudes, shown in Tables 1 and 2. Sample temperatures were measured using a radiation thermometer. Intermittent testing and forced-air cooling were utilized to maintain the sample temperature under 30 degrees C as required by the standard.
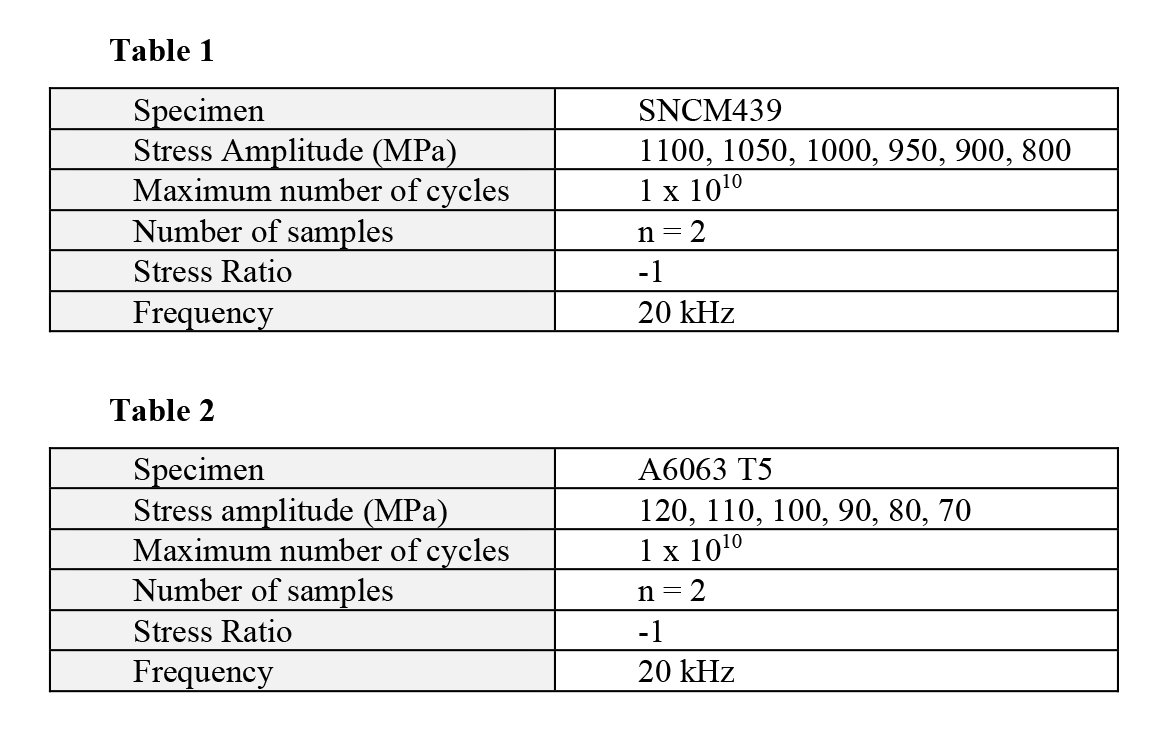
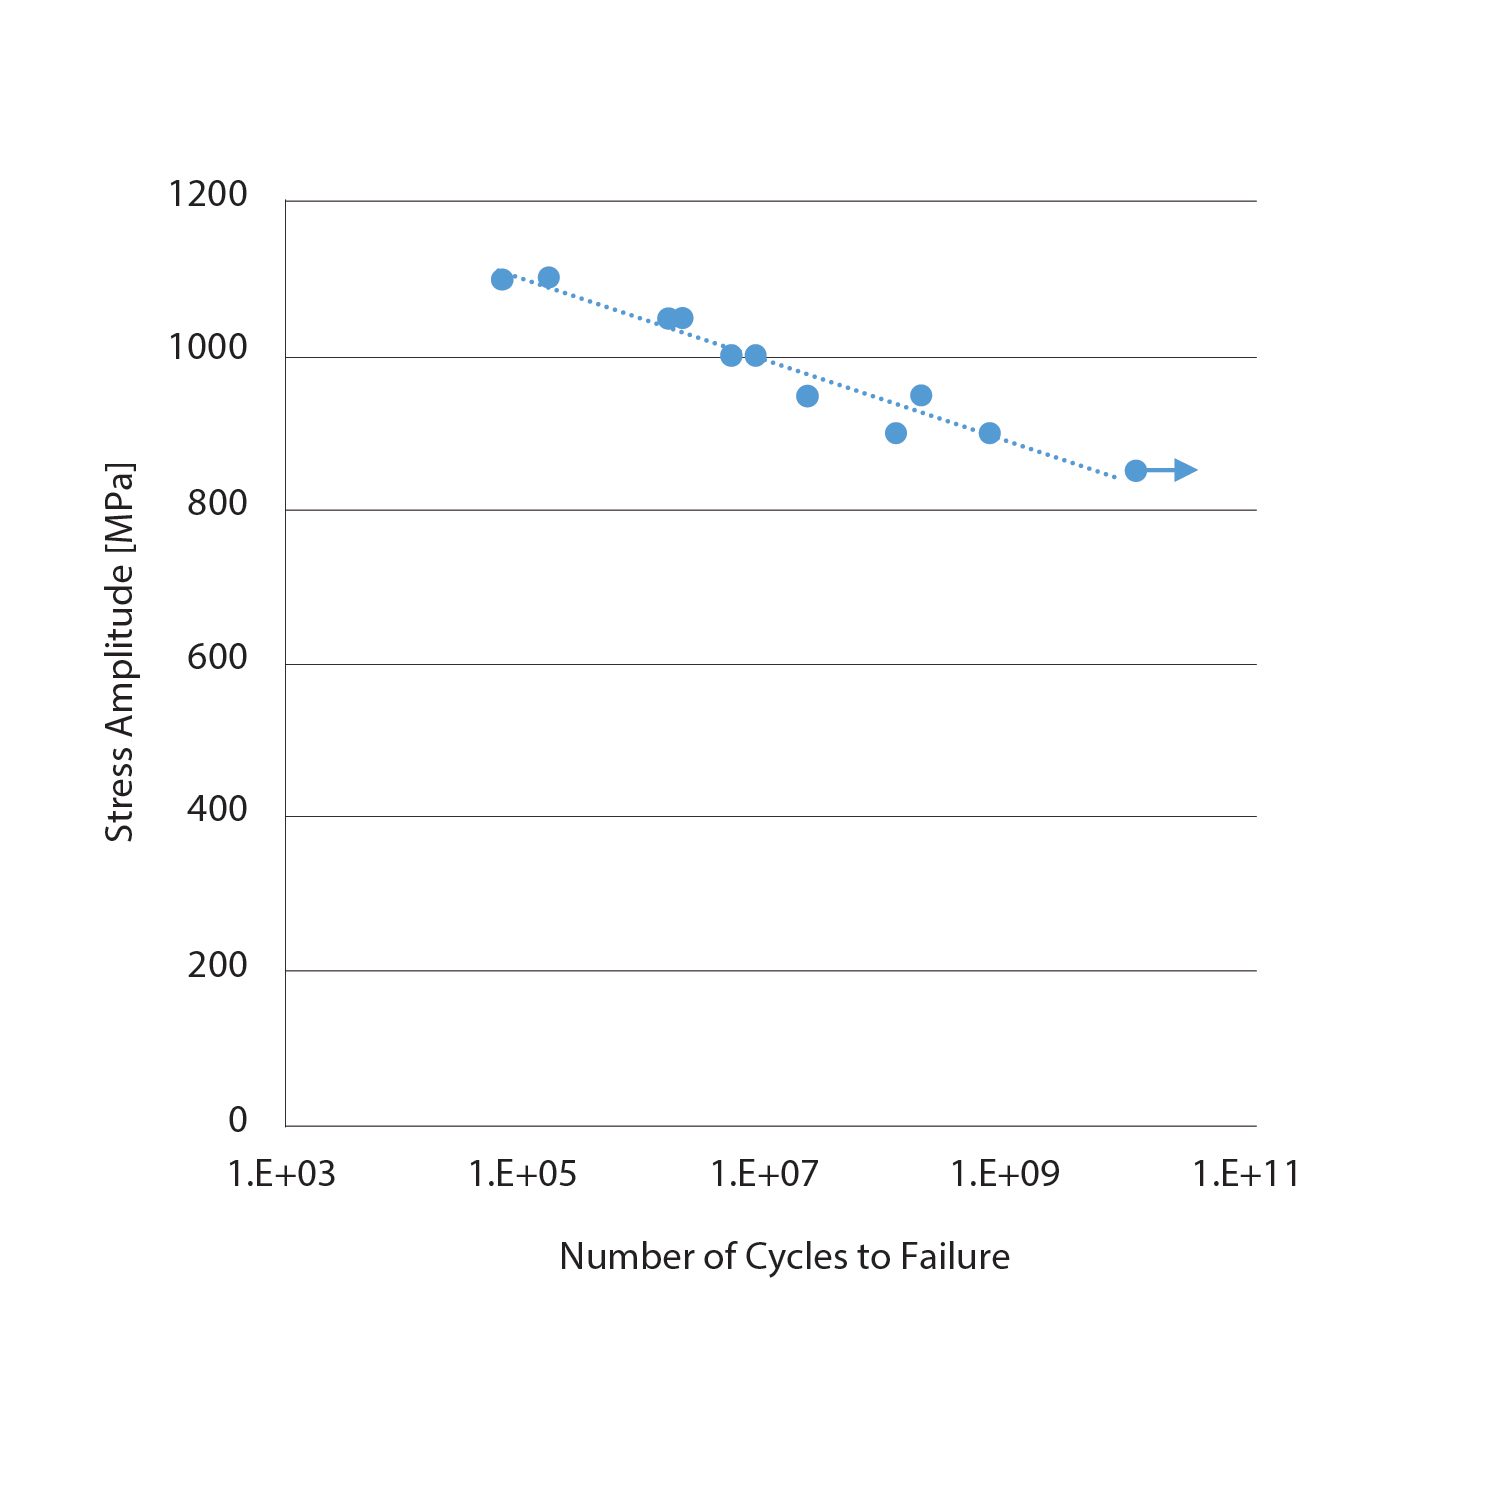
Figure 8: S/N diagram SNCM439
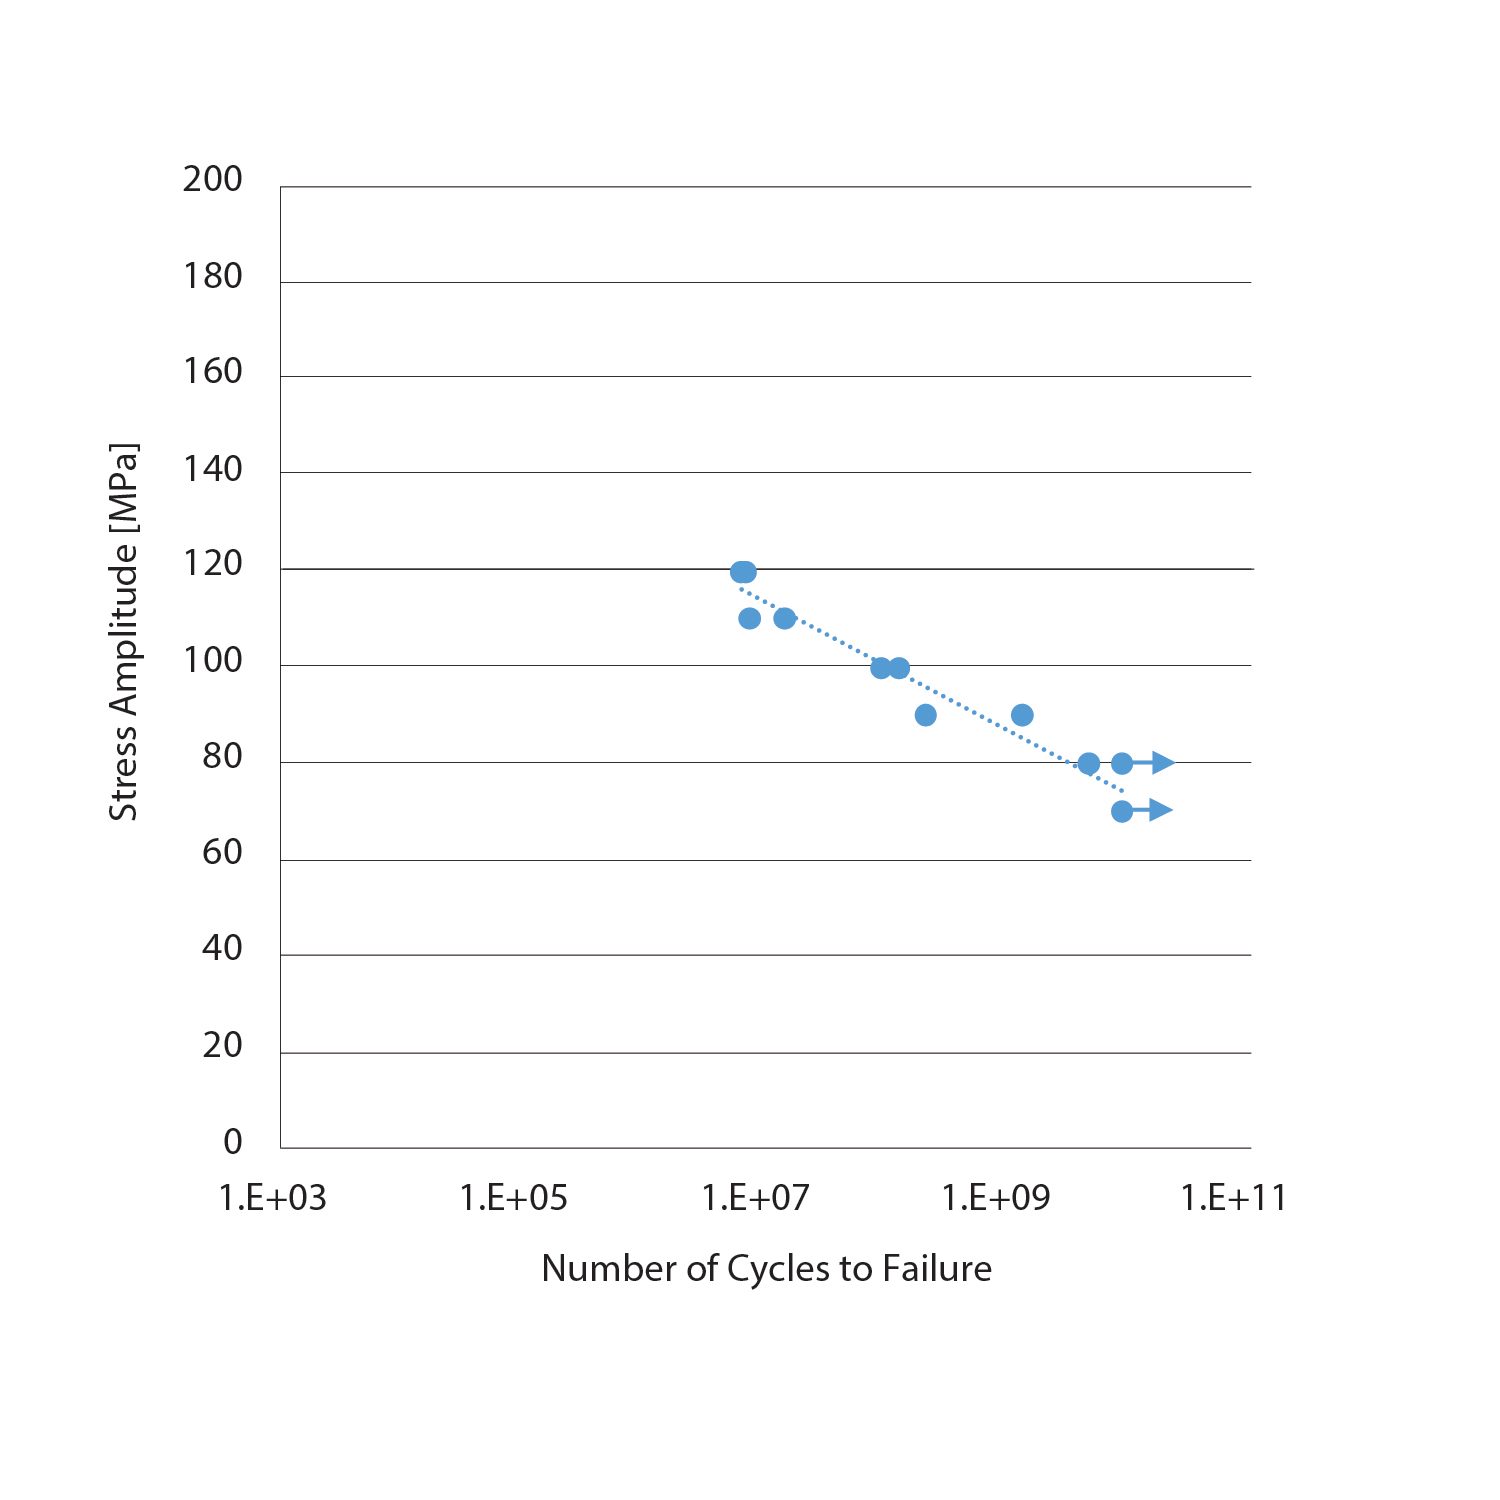
Figure 9: S/N diagram A6063 T5
Conclusion
At low stresses, these high strength materials fractured after 108 to 1010 cycles. This illustrates the importance of very high cycle fatigue testing for materials intended for high endurance, high reliability applications. It would be impractical to perform such very high cycle testing using a standard fatigue instrumentation.
References
- H. Kuhn and D. Medlin editors, ASM Handbook, Volume 8 Mechanical Testing and Evaluation
- ASTM E08.05.09 Very High Cycle Fatigue Testing working group.
- Standard Test Method for Ultrasonic Fatigue Testing of Metallic Materials. The Japan Welding Engineering Society WES 1112:2017
- F. Yano “Ultrasonic Fatigue Testing of Metal Materials”, Shimadzu Application News i258 July 2017
Opening Image Source: Travel_Motion/E+/via Getty Images.
All Images Source: Shimadzu
Christopher Macey, material science business group leader, Shimadzu Scientific Instruments (Columbia, MD); 410-910-0859; cjmacey@shimadzu.com.
August 2023 | Volume 62 | Number 8