Phased Array
Inspection
NDT
The Hilbert Transform’s Role in Transforming TFM
With improvements to TFM technology, more users of conventional phased array are showing interest in incorporating the method into their procedures.
By Emilie Peloquin
The main advantage of the total focusing method (TFM) is in the name. The entire TFM zone is focused, not merely a focal point at a certain depth like conventional phased array (PA). Despite its appeal, the prohibitive aspect of TFM for PA inspectors has been slower data collection and processing. Historically, it was slower than conventional PA because TFM requires full matrix capture (FMC) data acquisition, which collects a much larger volume of elementary data. Then all that acquired data must be processed to achieve total focusing in the TFM zone. However, as manufacturers of nondestructive testing (NDT) technology invest in TFM research and development, FMC data collection and TFM processing capabilities advance. With improvements to TFM technology, more users of conventional PA are showing interest in incorporating the method into their procedures.
With this rise in popularity of TFM technology comes growing demands for better signal representation and even faster data acquisition. Several tools have been introduced that accelerate FMC data collection, but the increase in speed often comes at the expense of signal quality. How can you move the probe faster? Simple! Collect fewer data, right? Although faster, this economizing at the data collection stage has a direct impact on the quality of the generated TFM image. For years, the industry has strived to produce technology equally capable of acquiring FMC data at fast acquisition rates and generating an optimal TFM image without sacrificing signal quality.
NDT’s Quest for Faster FMC with High-Quality TFM Imaging
There are multiple ways to speed up a TFM inspection. But there’s one novel and unique method that speeds up data collection while maintaining the sensitivity and meeting the amplitude fidelity requirements for TFM code compliance. The result is improved image quality and, by the same token, easier flaw sizing. This technology is due to an advancement in signal processing that uses the Hilbert transform called the “TFM envelope.”
Generally, when people in NDT refer to an envelope or even a TFM envelope, they mean a smoothing filter. For example, a typical low-pass envelope in conventional ultrasonic testing (UT) processing is one that filters out very high frequencies, leaving a more consistent and predictable signal. This is not how this particular TFM envelope works because it uses the Hilbert transform to generate its envelope. Applying the Hilbert transform is completely different from conventional signal smoothing since no information is lost.
Hilbert Transform Explained
In comparison to typical signal filters, think of the Hilbert transform like an “all-pass” filter, as all frequencies are allowed through. What it does change is the phase relationship of the various frequencies of the signal.
Without going into too much mathematical detail, when the Hilbert transform is applied, it’s as though the instrument operator has shifted the original signal in phase by 𝜋/2 radians. Figure 1 shows the behavior of a Hilbert transform in the frequency domain (transfer function), keeping the signal amplitude unchanged (Figure 1(a)) and shifting its phase by 𝜋/2 radians (Figure 1(b)).
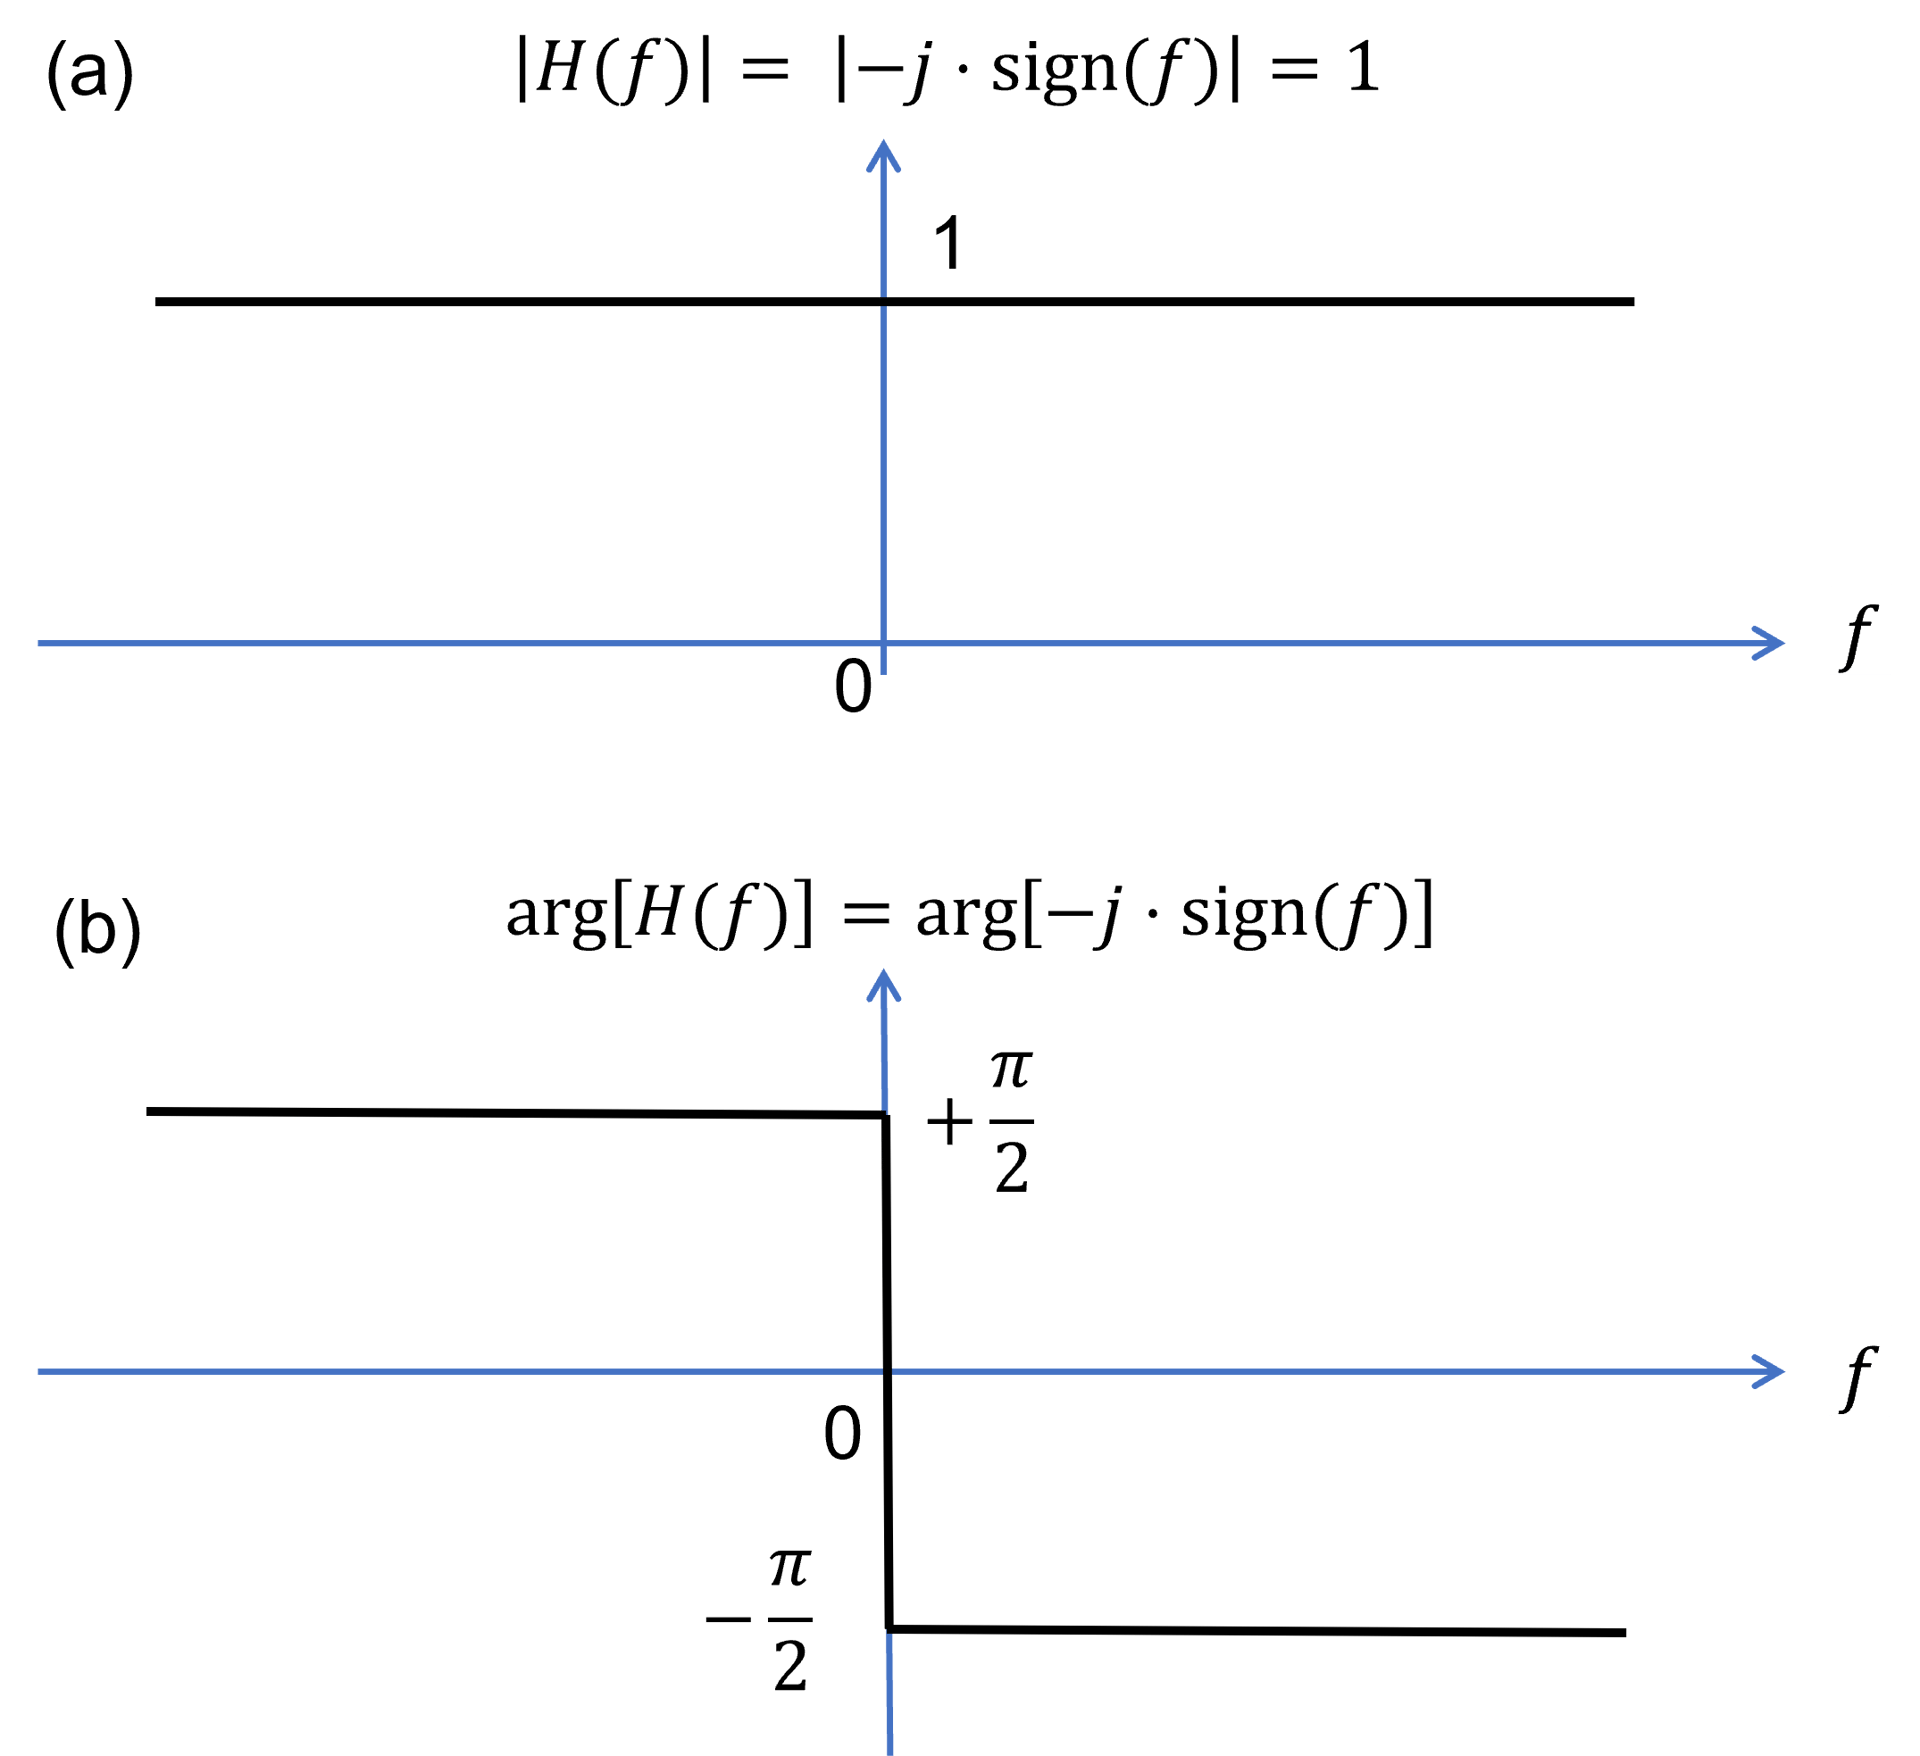
Figure 1. Transfer function of a Hilbert transform: (a) amplitude and (b) phase
This is useful for generating an accurate envelope. As shown in Figure 2, all three components are represented:
- In blue, the “normal” in-phase signal, or original A-scan
- In green, the + and − 𝜋/2 or quadrature components, thanks to the Hilbert transform
- In red, the traced envelope over both signals
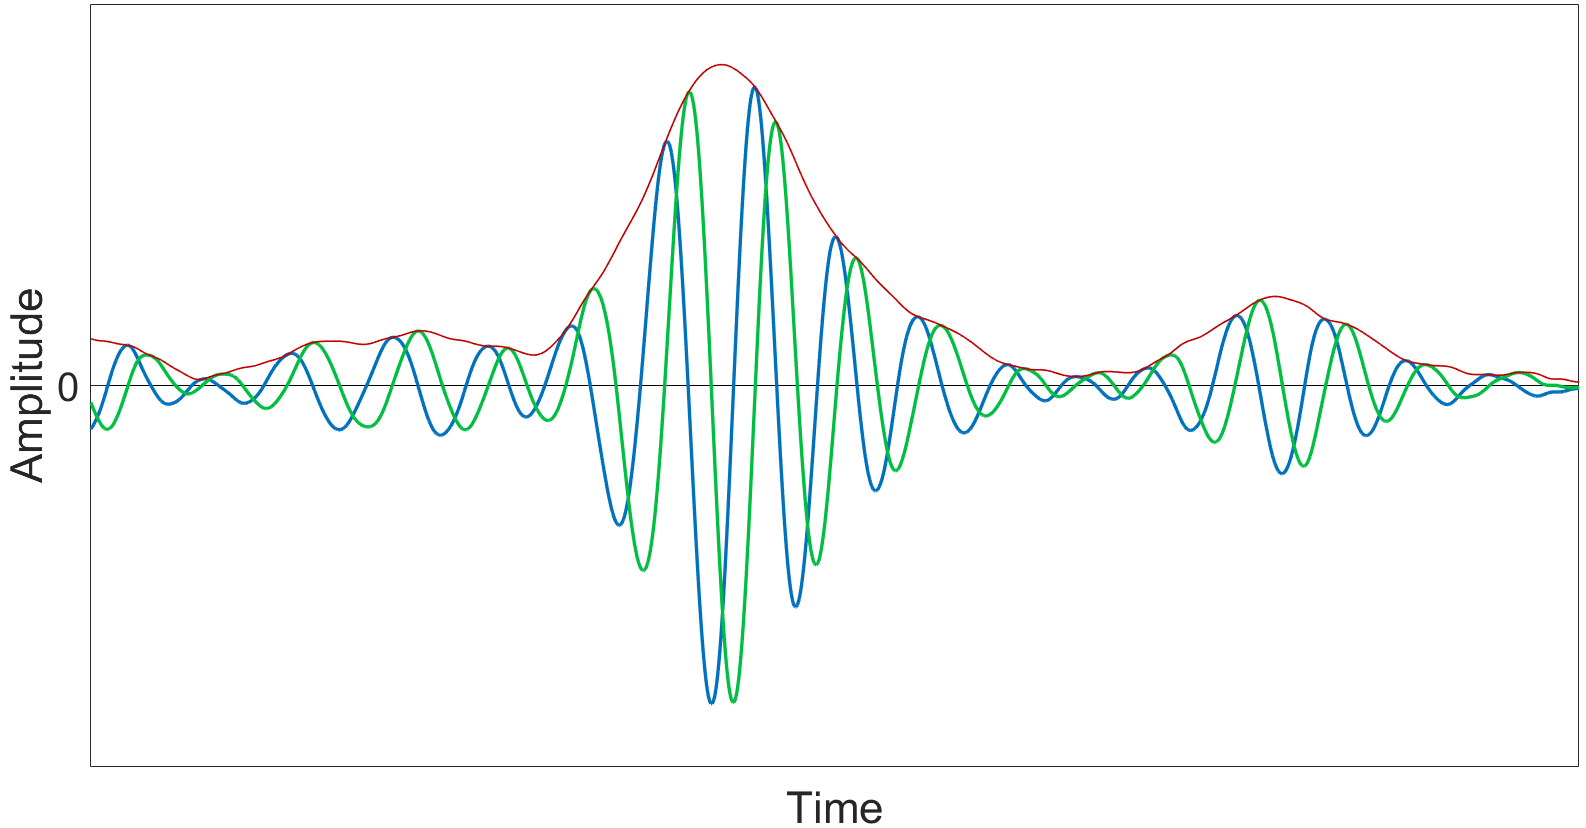
Figure 2. The in-phase A-scan signal (blue), the Hilbert transform + and − 𝜋/2 or quadrature components (green) and the TFM envelope over both signals (red)
Creating an envelope using the Hilbert transform in TFM offers multiple advantages:
• Smooths the image without losing any information unlike typical filters
• Offers higher resolution enabling more accurate flaw sizing
• Improves amplitude fidelity (AF) for the TFM grid
The Importance of Amplitude Fidelity for TFM
Depending on the digitizing frequency in PA or grid resolution in TFM, the maximum amplitude of a signal can be missed, resulting in the wrong amplitude in the digitized signal. A higher digitizing frequency or a finer grid resolution helps reduce amplitude errors.
AF requirements are in place to make sure that the size of each pixel in the TFM grid fits the size of the wavelength. The size ratio of a pixel versus the wavelength of the ultrasonic beam is important. Too large a pixel could miss the peak amplitude, just like a digitizing frequency that is too low might miss the peak in a conventional phased array signal.
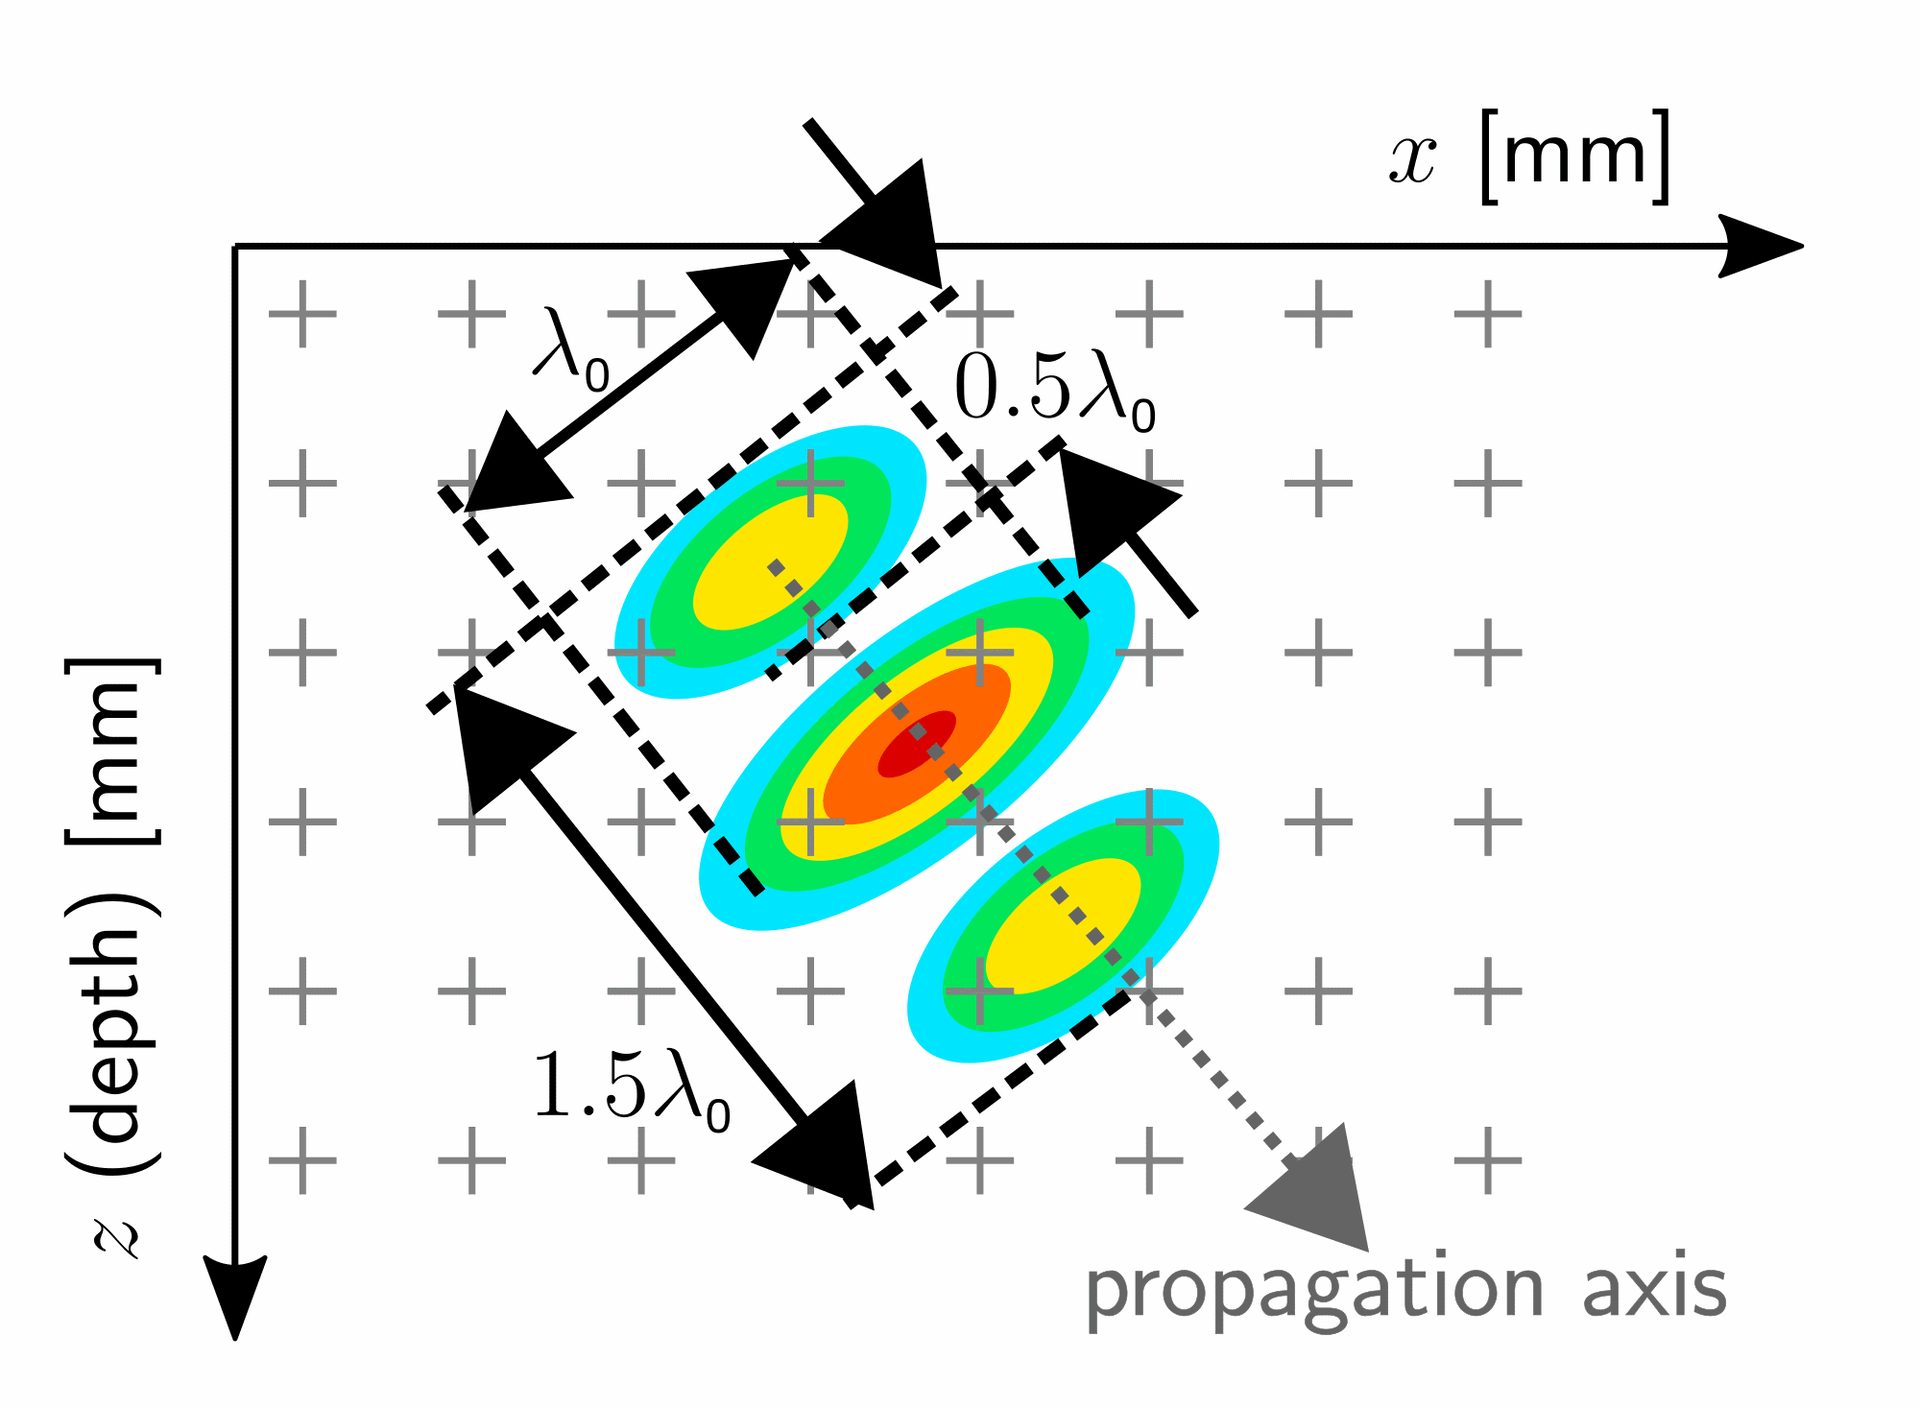
Figure 3. Color scale representation of the rectified amplitude TFM image of a hypothetical point scatterer using a common large bandwidth pulsed signal (λ0 = probe central wavelength)
Figure 3 illustrates this pixel versus wavelength size problem. Since the true maximum amplitude (small red ellipse) is located between the measurement points of the grid (gray plus signs), it will not be measured when processing the TFM image. Rather, a lower amplitude (yellow ellipse) will be calculated as the maximum. This error in maximum amplitude caused by the coarse grid resolution could result in a flaw size overestimation (when using amplitude-based sizing techniques).
The AF value is the variation in decibels (dB) between the true maximum amplitude (red ellipse in Figure 3) and the maximum amplitude measured by the TFM grid, which in this example is represented by the yellow ellipse. The standard requirement in TFM codes is an AF value of no more than 2 dB.
How the TFM Envelope Improves upon Conventional TFM
The Hilbert-transform-based TFM envelope offers a notable improvement in amplitude fidelity versus the “normal” or original rectified A-scan signal (Figure 4). The sampling rate required to achieve the same amplitude fidelity is much lower when working from the signal envelope (in red) than from the rectified signal (in blue).
In phased array ultrasonic testing, a digitizing frequency of five times the frequency of the probe is used to avoid amplitude errors. The same logic applies for TFM, where five samples per period, or per wavelength (lambda/5), is considered sufficient to avoid amplitude errors greater than 2 dB.
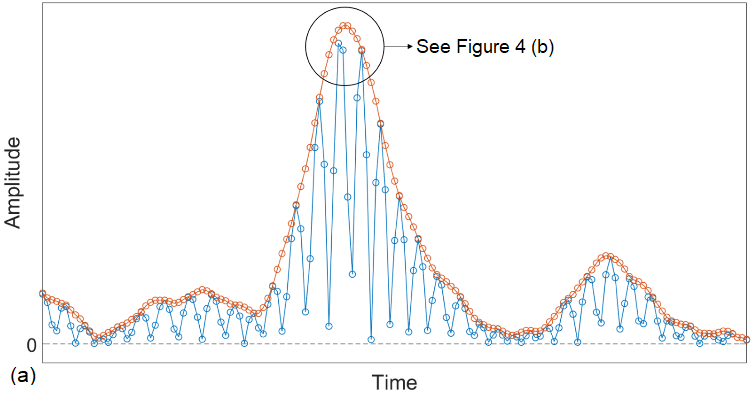
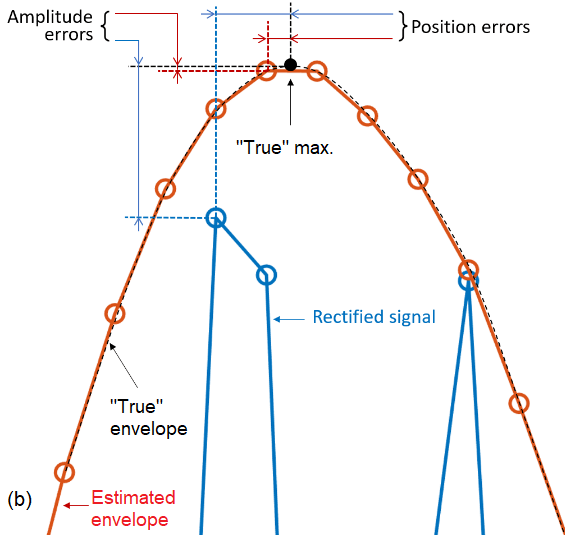
Figure 4. Envelope (red) versus rectified A-scan (blue) maximum amplitude error margins
With standard TFM with oscillation based on rectified A-scan signals, we can sometimes see “doubling” of the signal. The strictly positive values and signal oscillation leads to two maximums in the example shown in Figure 5, but only one maximum when using the TFM envelope.
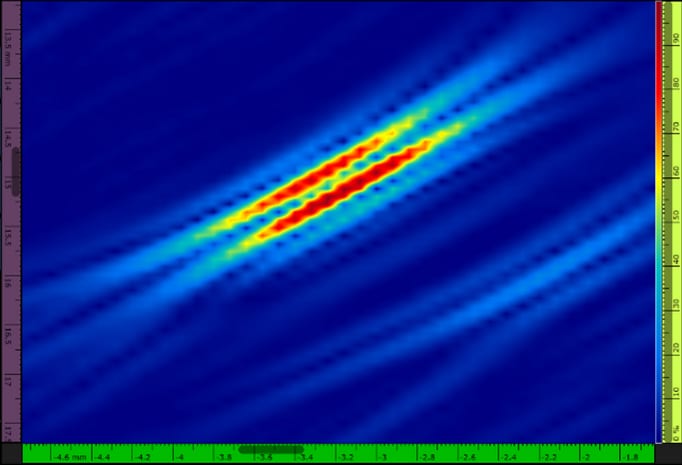
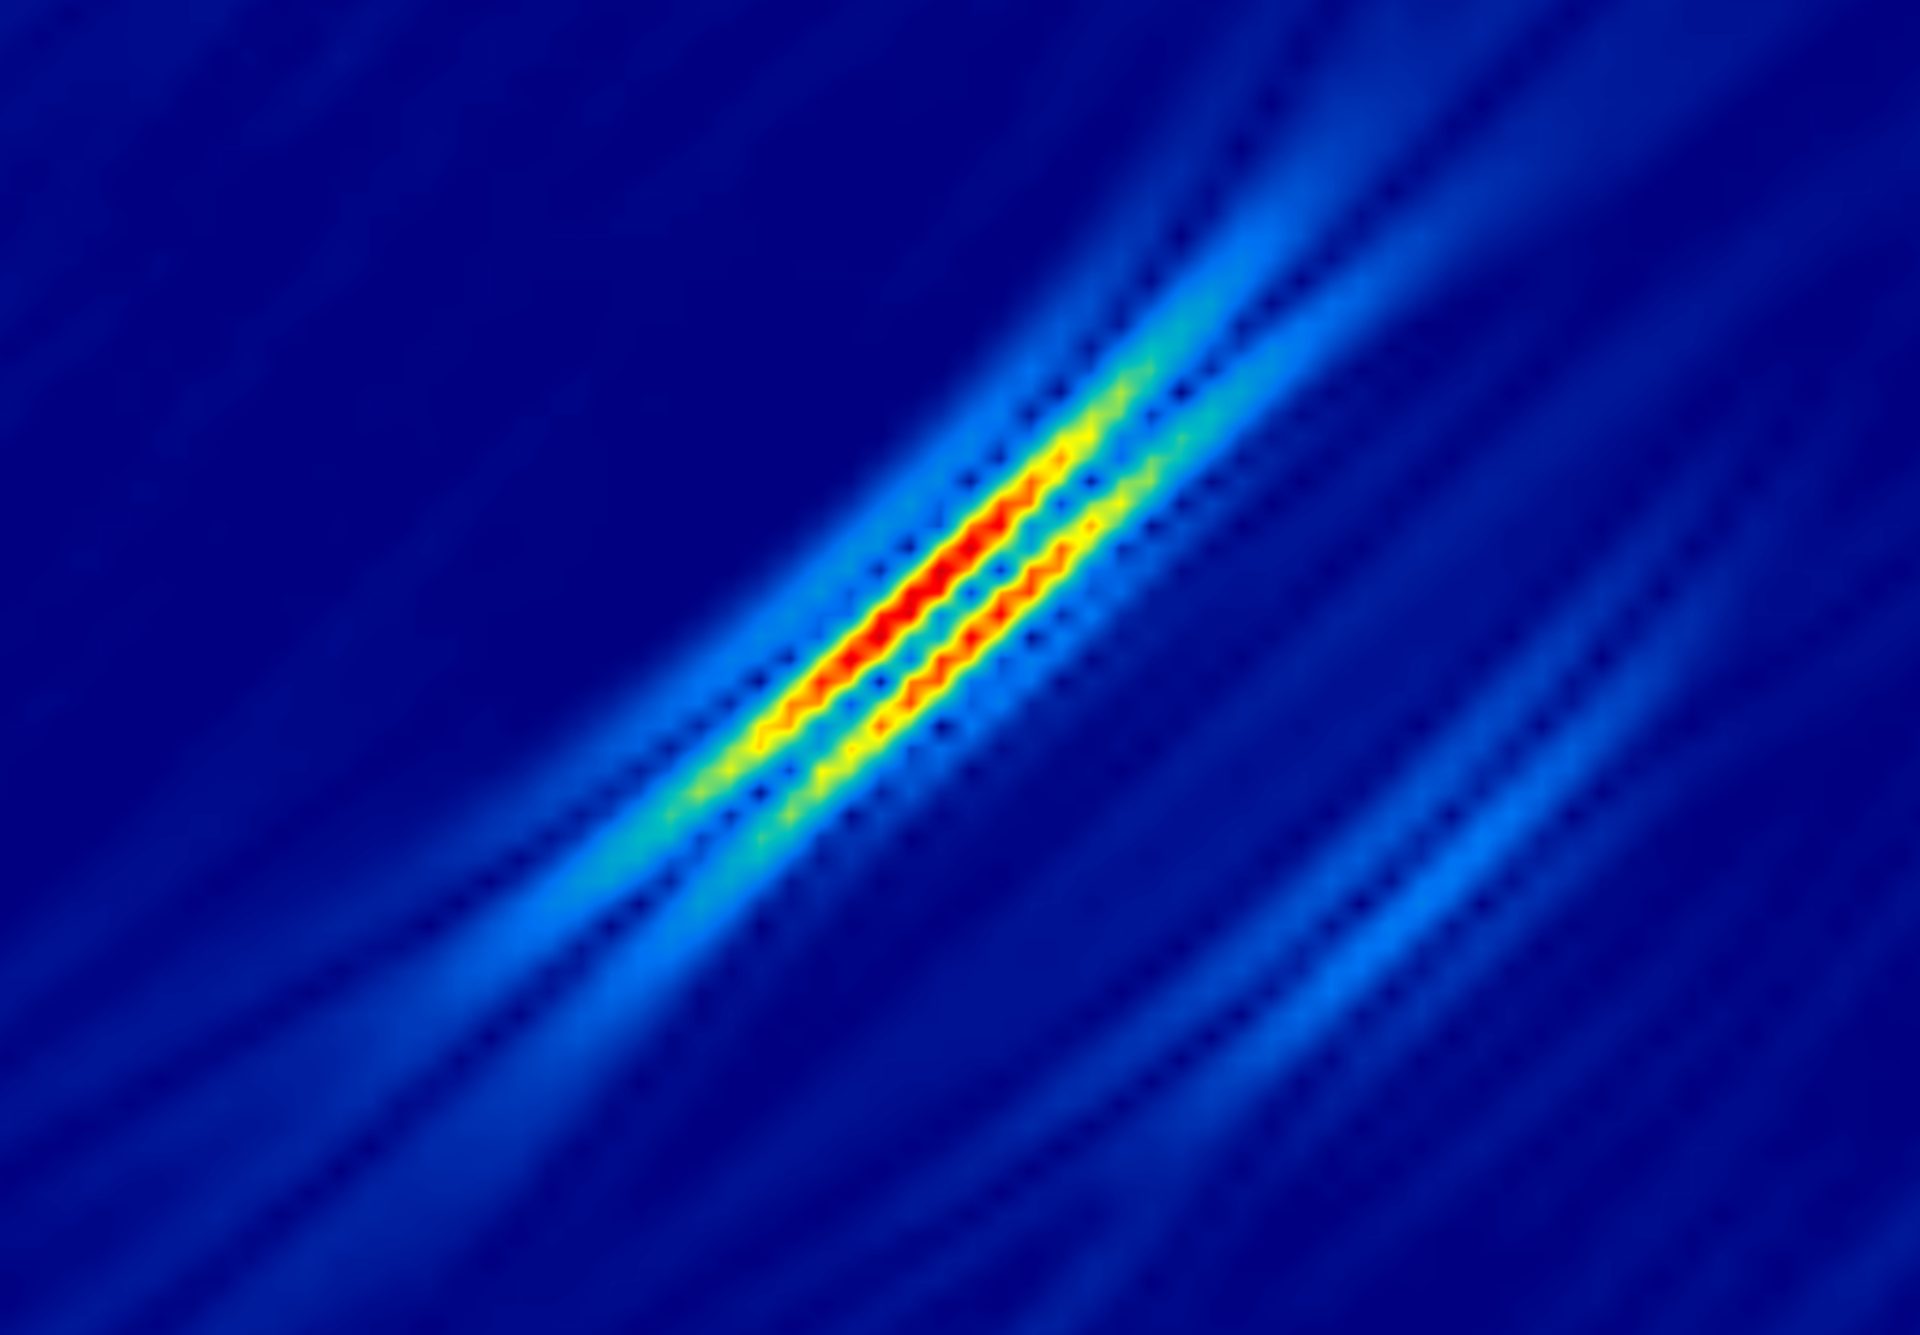
Figure 5. TFM images of a side-drilled hole―both with a 0.08 mm (λ/8.1) grid resolution and 108.7% maximum amplitude settings―using rectified amplitude and with signal oscillation (left) and using the TFM envelop (right)
In this way, the TFM envelope also facilitates proper sizing and positioning of the defect. The doubling oscillations of standard TFM do not provide any relevant information on the indication. They are due to the frequency characteristics of the probe, i.e., the central frequency and bandwidth, not caused by the defect itself. Applying the TFM envelope rids the image of this superfluous information to concentrate the indication analysis on only relevant signals, enabling a better estimation of the position and amplitude.
Main Takeaways on the TFM Envelope
Since the TFM envelope is generated using the Hilbert transform, no signal information is lost. Only the amplitude information is retained to reconstruct the envelope.
The TFM envelope image eliminates signal oscillations or image doubling resulting from the probe’s central frequency, facilitating indication sizing and improving positioning accuracy. You can also achieve a code-compliant amplitude fidelity more easily compared with an inspection at the same speed using conventional TFM.
What’s most important to remember: not all TFM envelopes are created equal. A TFM envelope that uses smoothing filtering will lose valuable information versus one that uses the Hilbert transform.
Ian R. Lazarus is president and CEO of Creato Performance Solutions, providing leadership development, training, and solutions to support operational excellence.
Jim L. Smith has more than 45 years of industry experience in operations, engineering, research & development and quality management.

Emilie Peloquin has been working in the welding/NDT industry since 2009. She holds an associate degree in Applied Science and is educated in a wide variety of NDT methods. She joined Olympus, now Evident, in 2014 and has held positions ranging from technical support to product management, focusing on ultrasonic, phased array, and other advanced inspection technologies. As a global advanced product support director, she’s involved in business and product development, supporting a variety of applications across numerous industries. Peloquin is also heavily involved in codes and standards development for ultrasonic techniques and was elected in 2022 to the board of directors for the American Society for Nondestructive Testing (ASNT). For more information, visit Evidentscientific.com.
August 2022 | Volume 61 | Number 8