Recently, researchers have shown correlation between particle hardness and cycle performance. By Christopher Macey
Hardness Testing
of Individual Battery Electrode Particulates
Test & INspection
Recently, researchers have shown correlation between particle hardness and cycle performance. By Christopher Macey
Hardness Testing
of Individual Battery Electrode Particulates
Test & INspection
The hardness of powder materials used to fabricate battery electrodes is an important parameter in determining battery lifetime. Particulate electrode materials are subject to significant stresses during cell fabrication. While in use, battery cyclic charging and discharging induces mechanical stresses in the electrode materials, which can significantly impact long-term stability. Recently, researchers have shown correlation between particle hardness and cycle performance of layered lithium-ion battery cathode materials1.
This article describes a novel micro-compression instrument and technique for determining the hardness of individual particles using controlled uniaxial compression. Brief examples of the technique used to characterize and compare the hardness of battery anode materials are provided. Several more in-depth examples are provided in the listed references.
Instrument and Measurement Technique
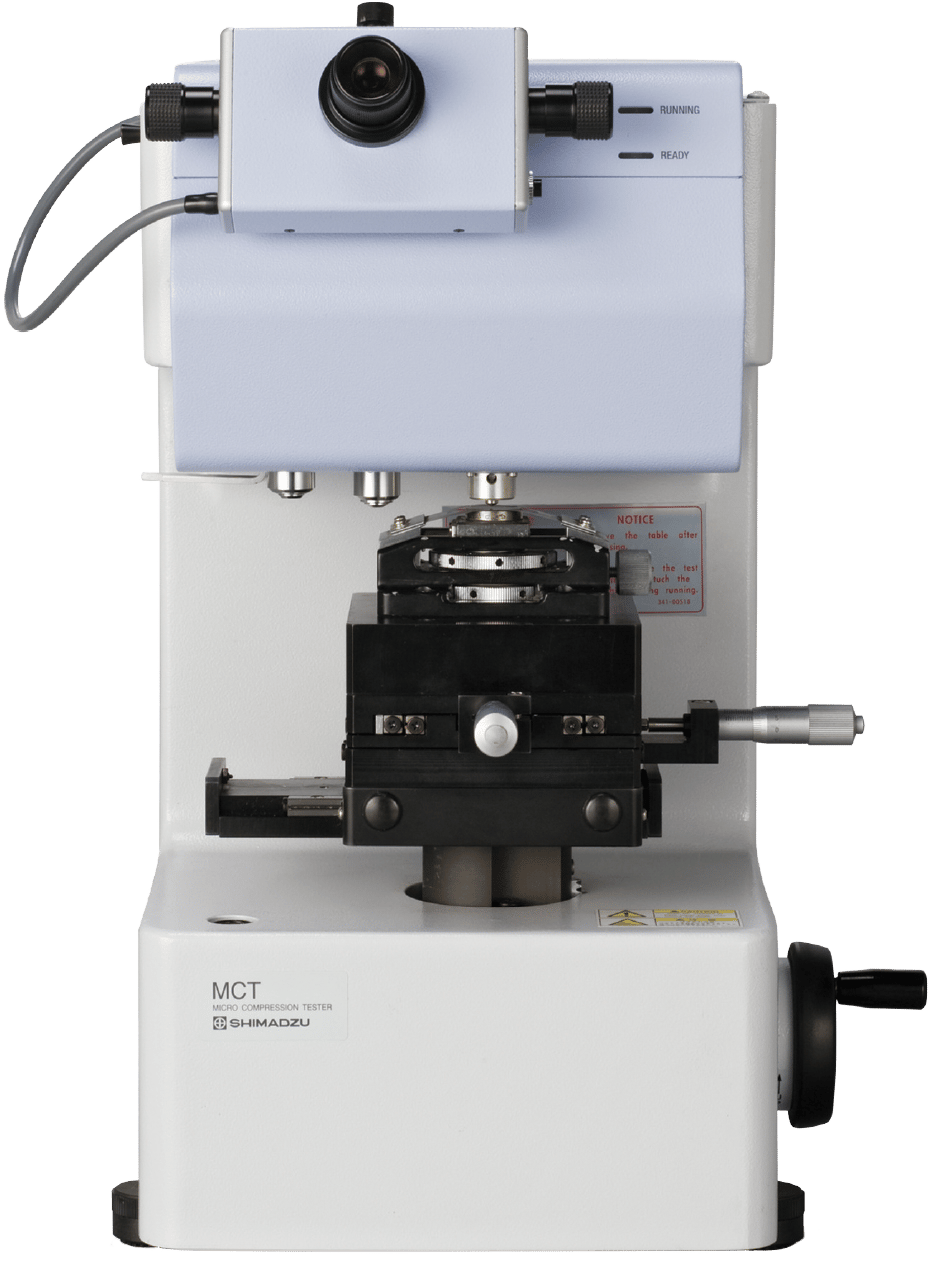
An image of a micro-compression tester and schematic of the test are shown in figure 1.
The PC controlled system is comprised of the following components: a top-mounted optical 500X sample imaging unit with micrometer and PC display, a lower compression platen mounted onto a precision X-Y stage, an electro-magnetic force loading unit with a test force range of 9.8 to 4900mN or 1960mN, a 50 or 500-micron diameter flat diamond sample indenter and a differential transformer compression displacement detector. A side-mounted camera allows the measurements to be viewed and stored on video.
This instrument may be modified for elevated temperature testing up to 250 C. In addition, an electrical resistance measurement assembly is also available allowing particle electrical resistance to be monitored during the compression experiment.
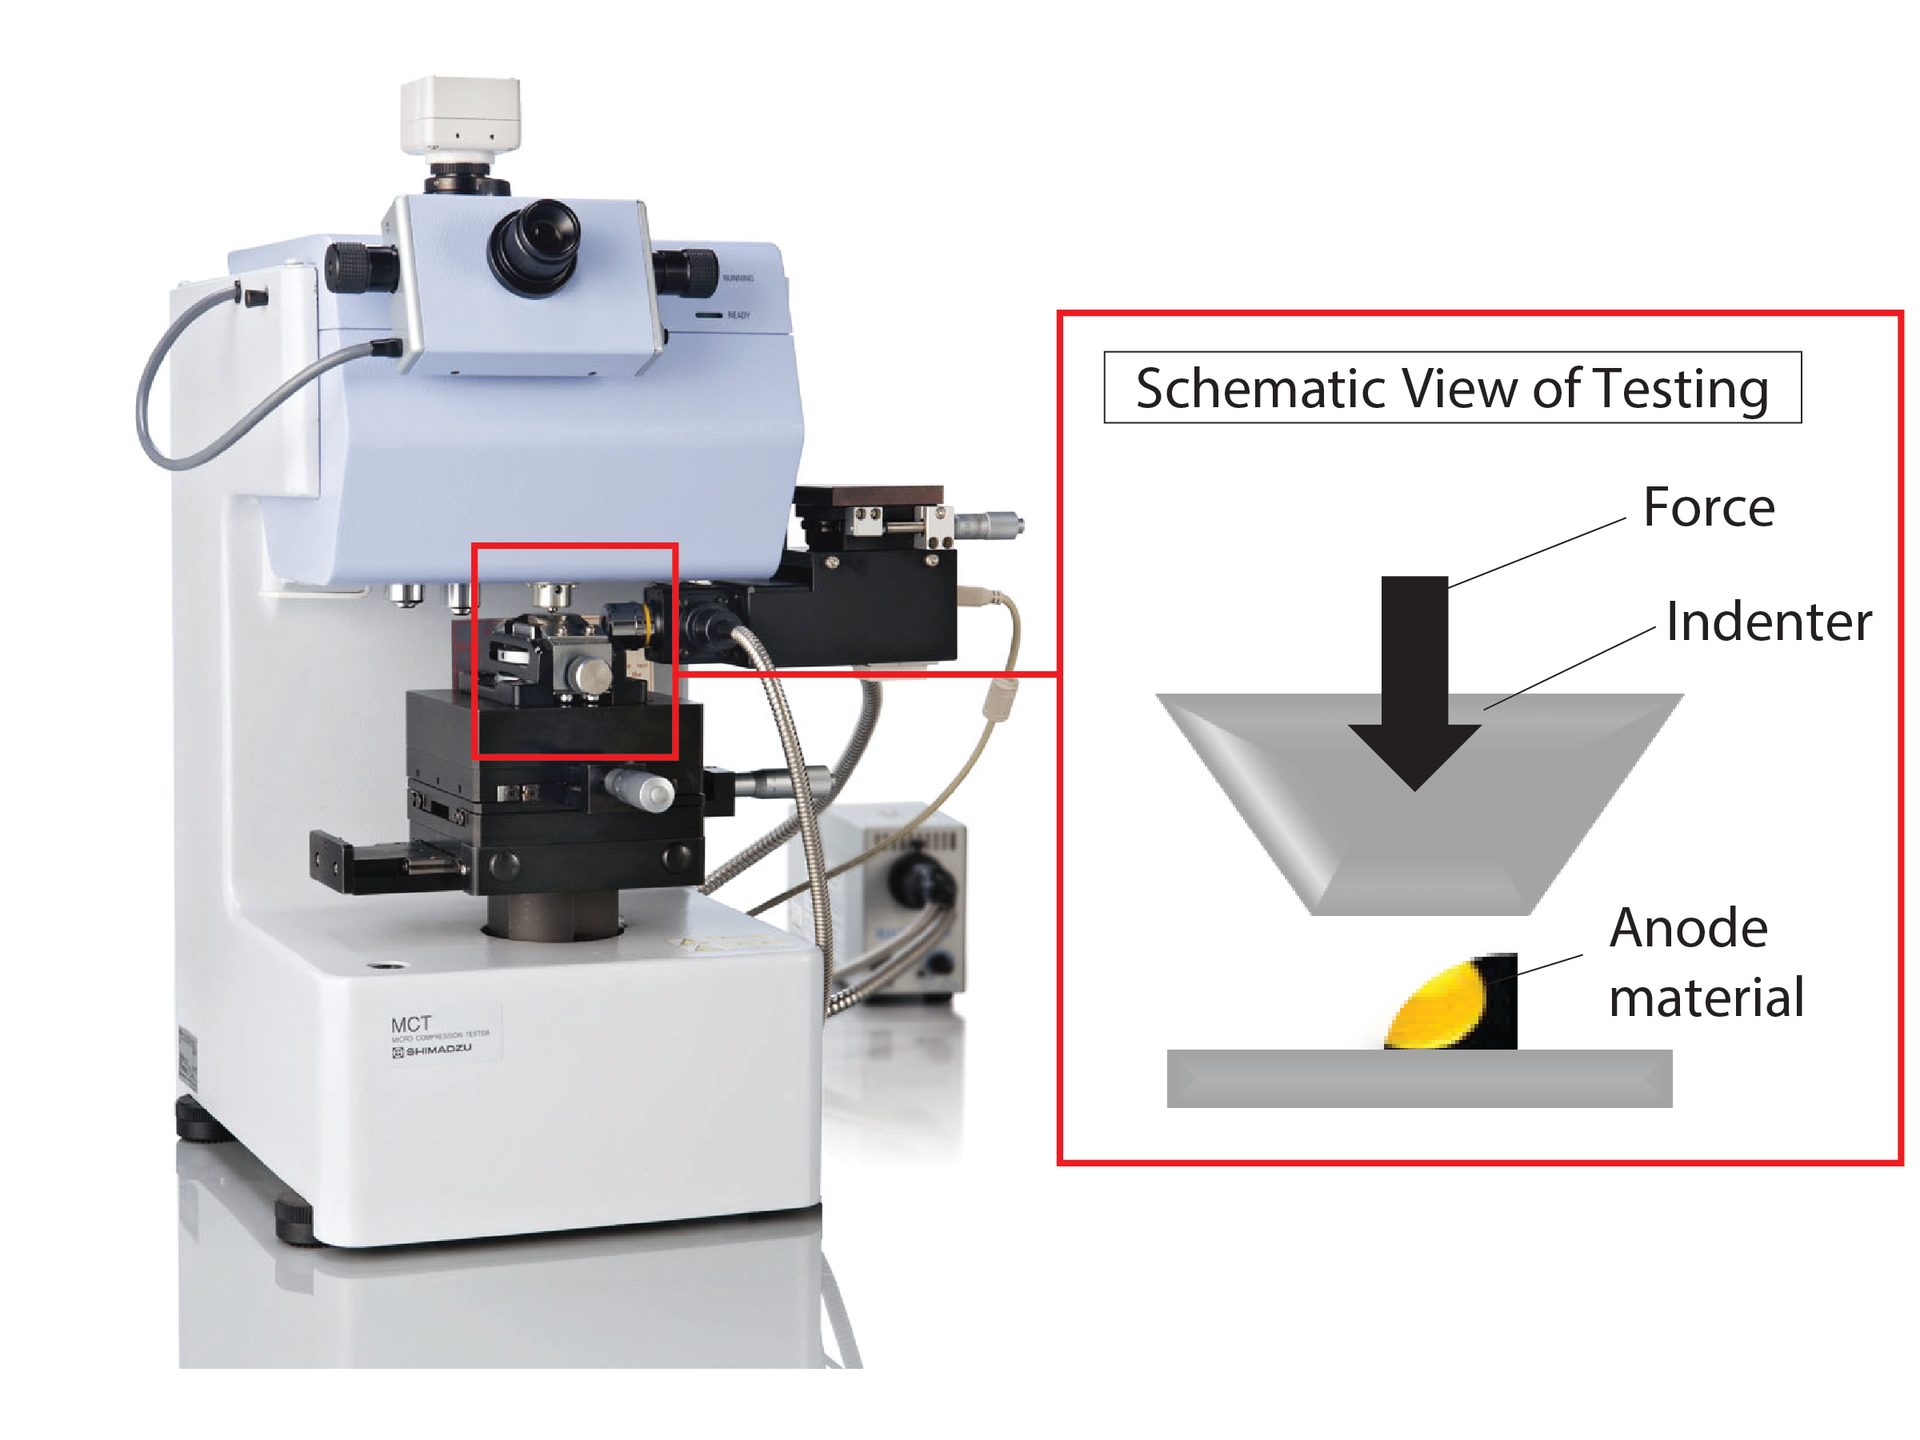
Figure 1: Micro-compression system and schematic view of test
Hardness Testing of Individual Battery Electrode Particulates
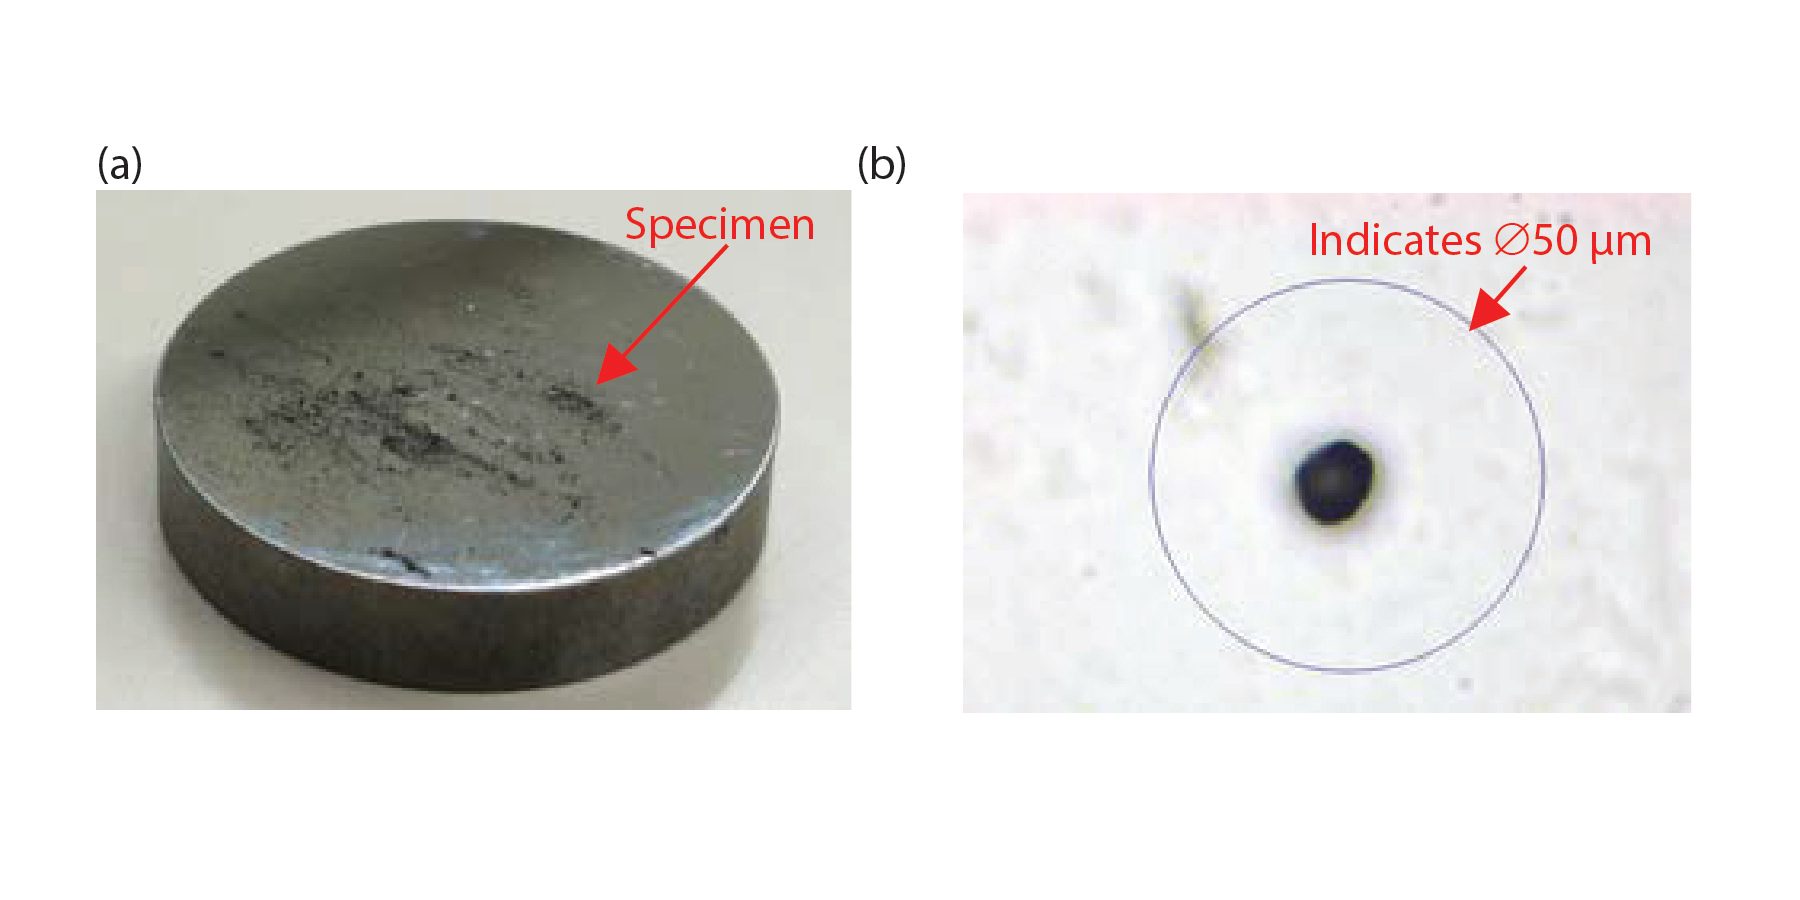
To conduct a measurement, particles are dispersed on the lower platen. Individual particles are imaged and selected for analysis using the top-loaded optical system(figure 2a and b). The particle dimensions are measured, and a geometric mean diameter is calculated. The particle is positioned for testing under the indenter using the X-Y stage. A compressive force is applied to the specimen at a constant programmable rate (figure 3) and the force versus displacement curve is acquired and stored.
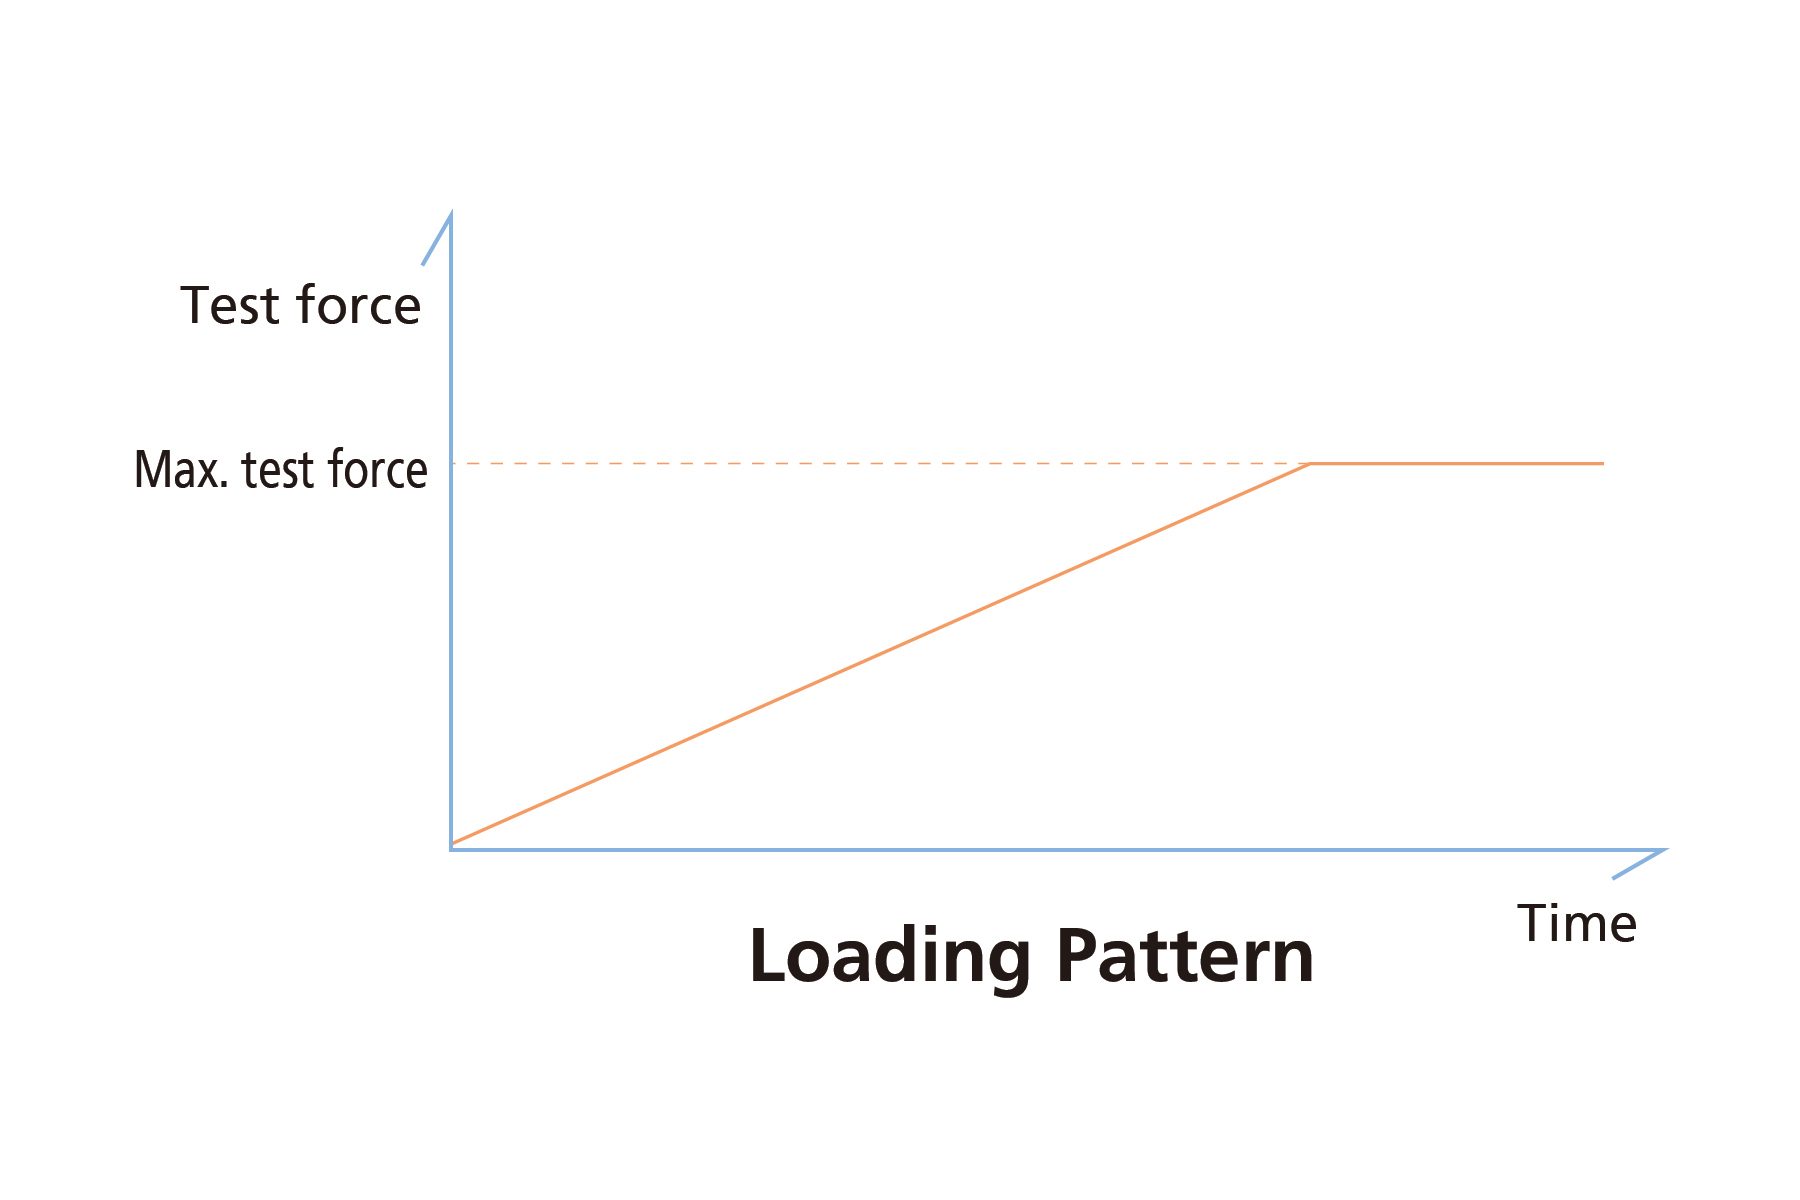
Figure 3: Force loading pattern
Figure 2: 2a shows graphite anode material dispersed on the lower compression platen; 2b shows an individual particle viewed prior to analysis.
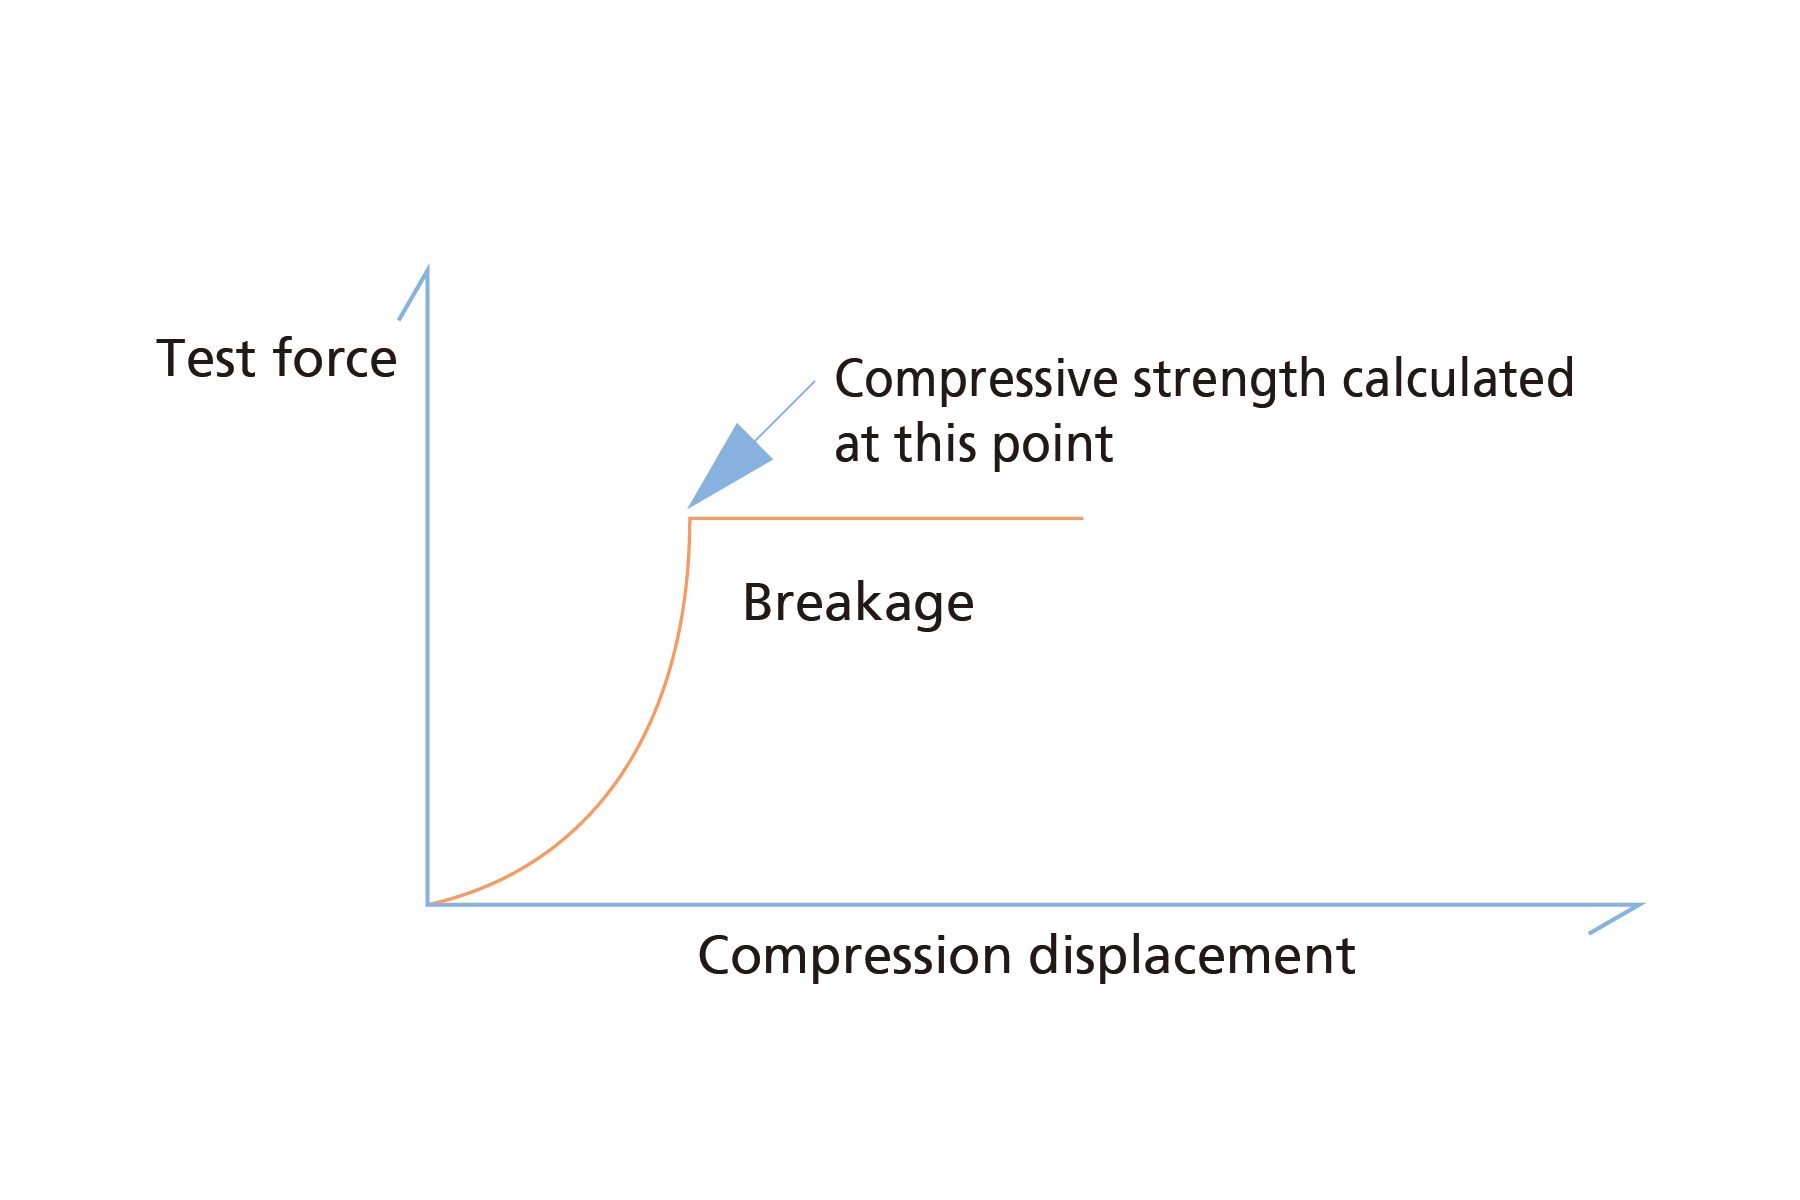
Tests are typically conducted until the sample breaks (figure 4) or until a predefined percentage displacement is observed (figure 5). Particle deformation strength or hardness may then be calculated from established formulae which relate the applied force, displacement, and the initial individual particle dimensions2,3. Cyclic loading measurements may also be conducted.
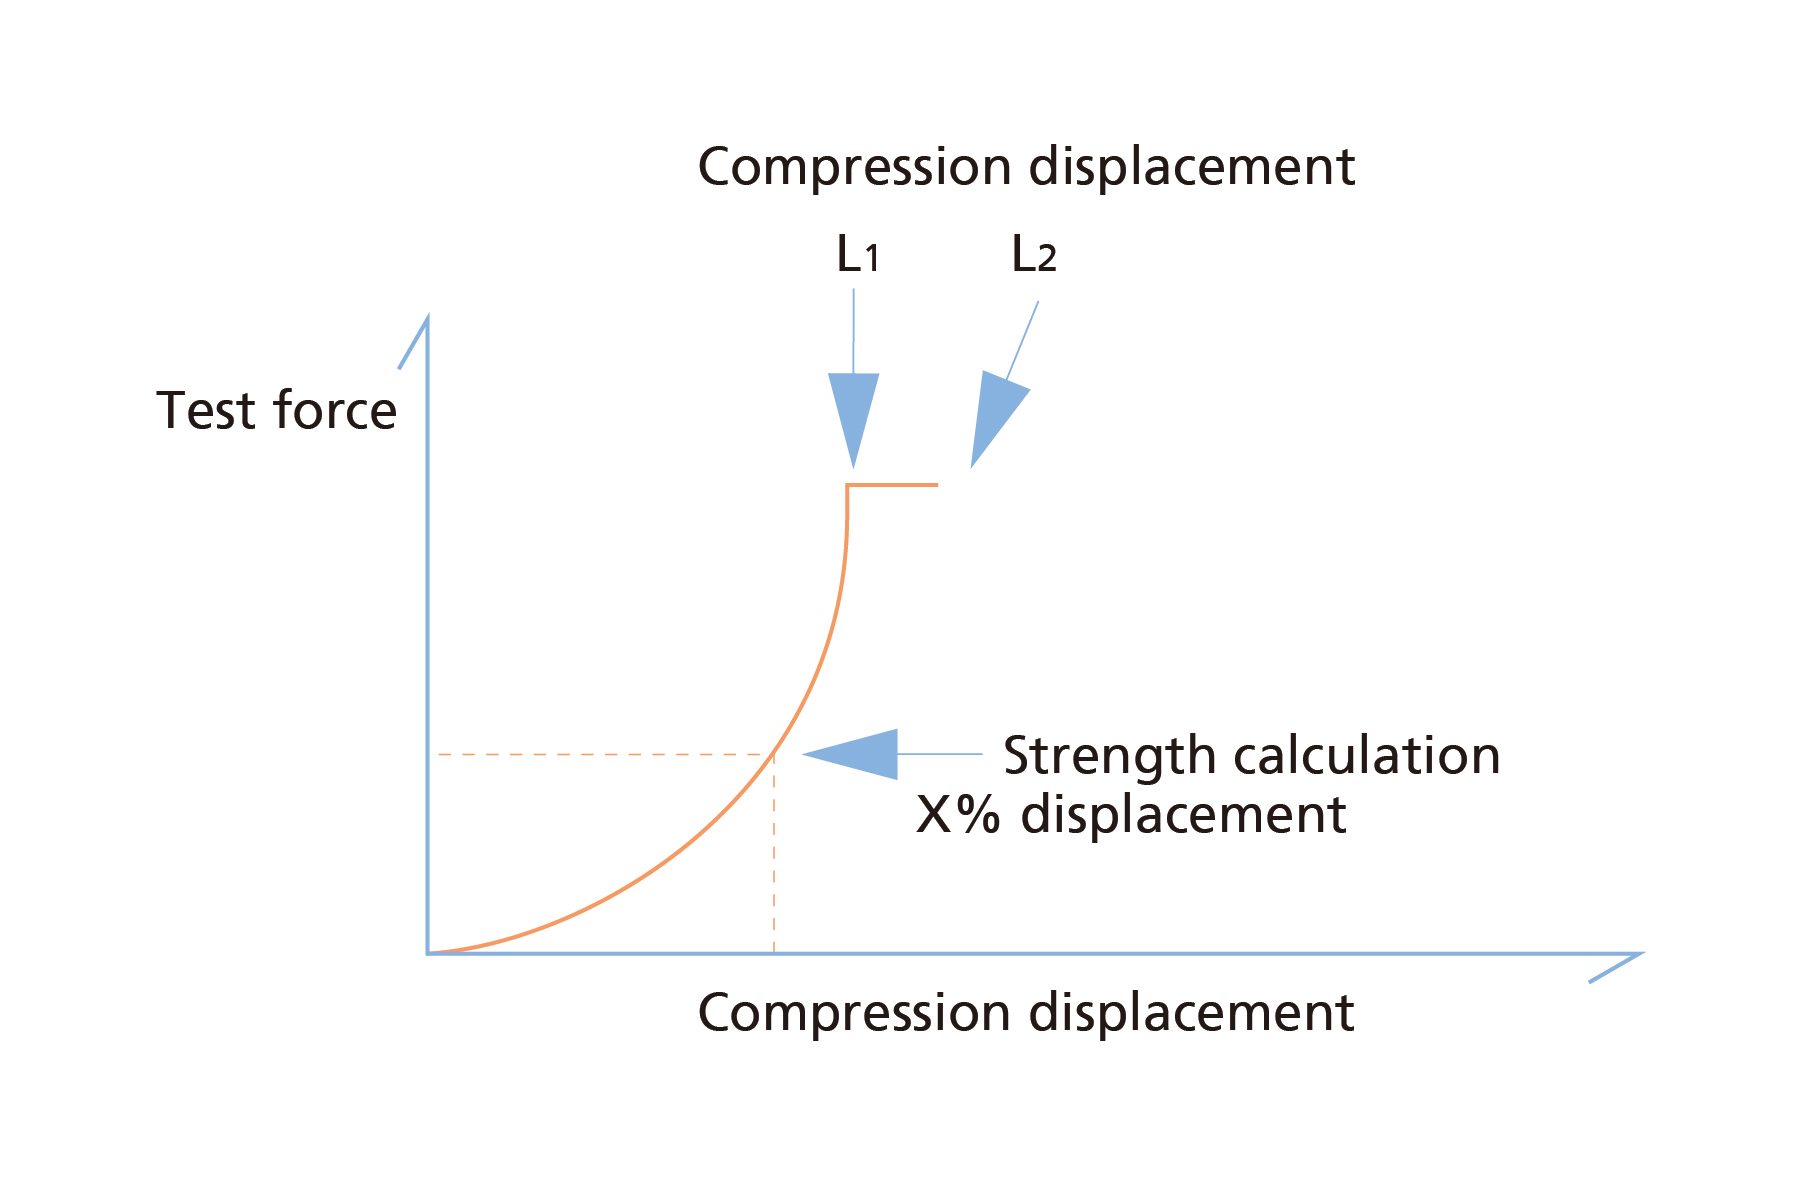
Figure 5: Force displacement curve without clear break point
Figure 4: Force displacement curve showing clear particle breaking point
The following examples illustrate the technique applied to battery materials:
Example 1: Comparison of active particle material strength
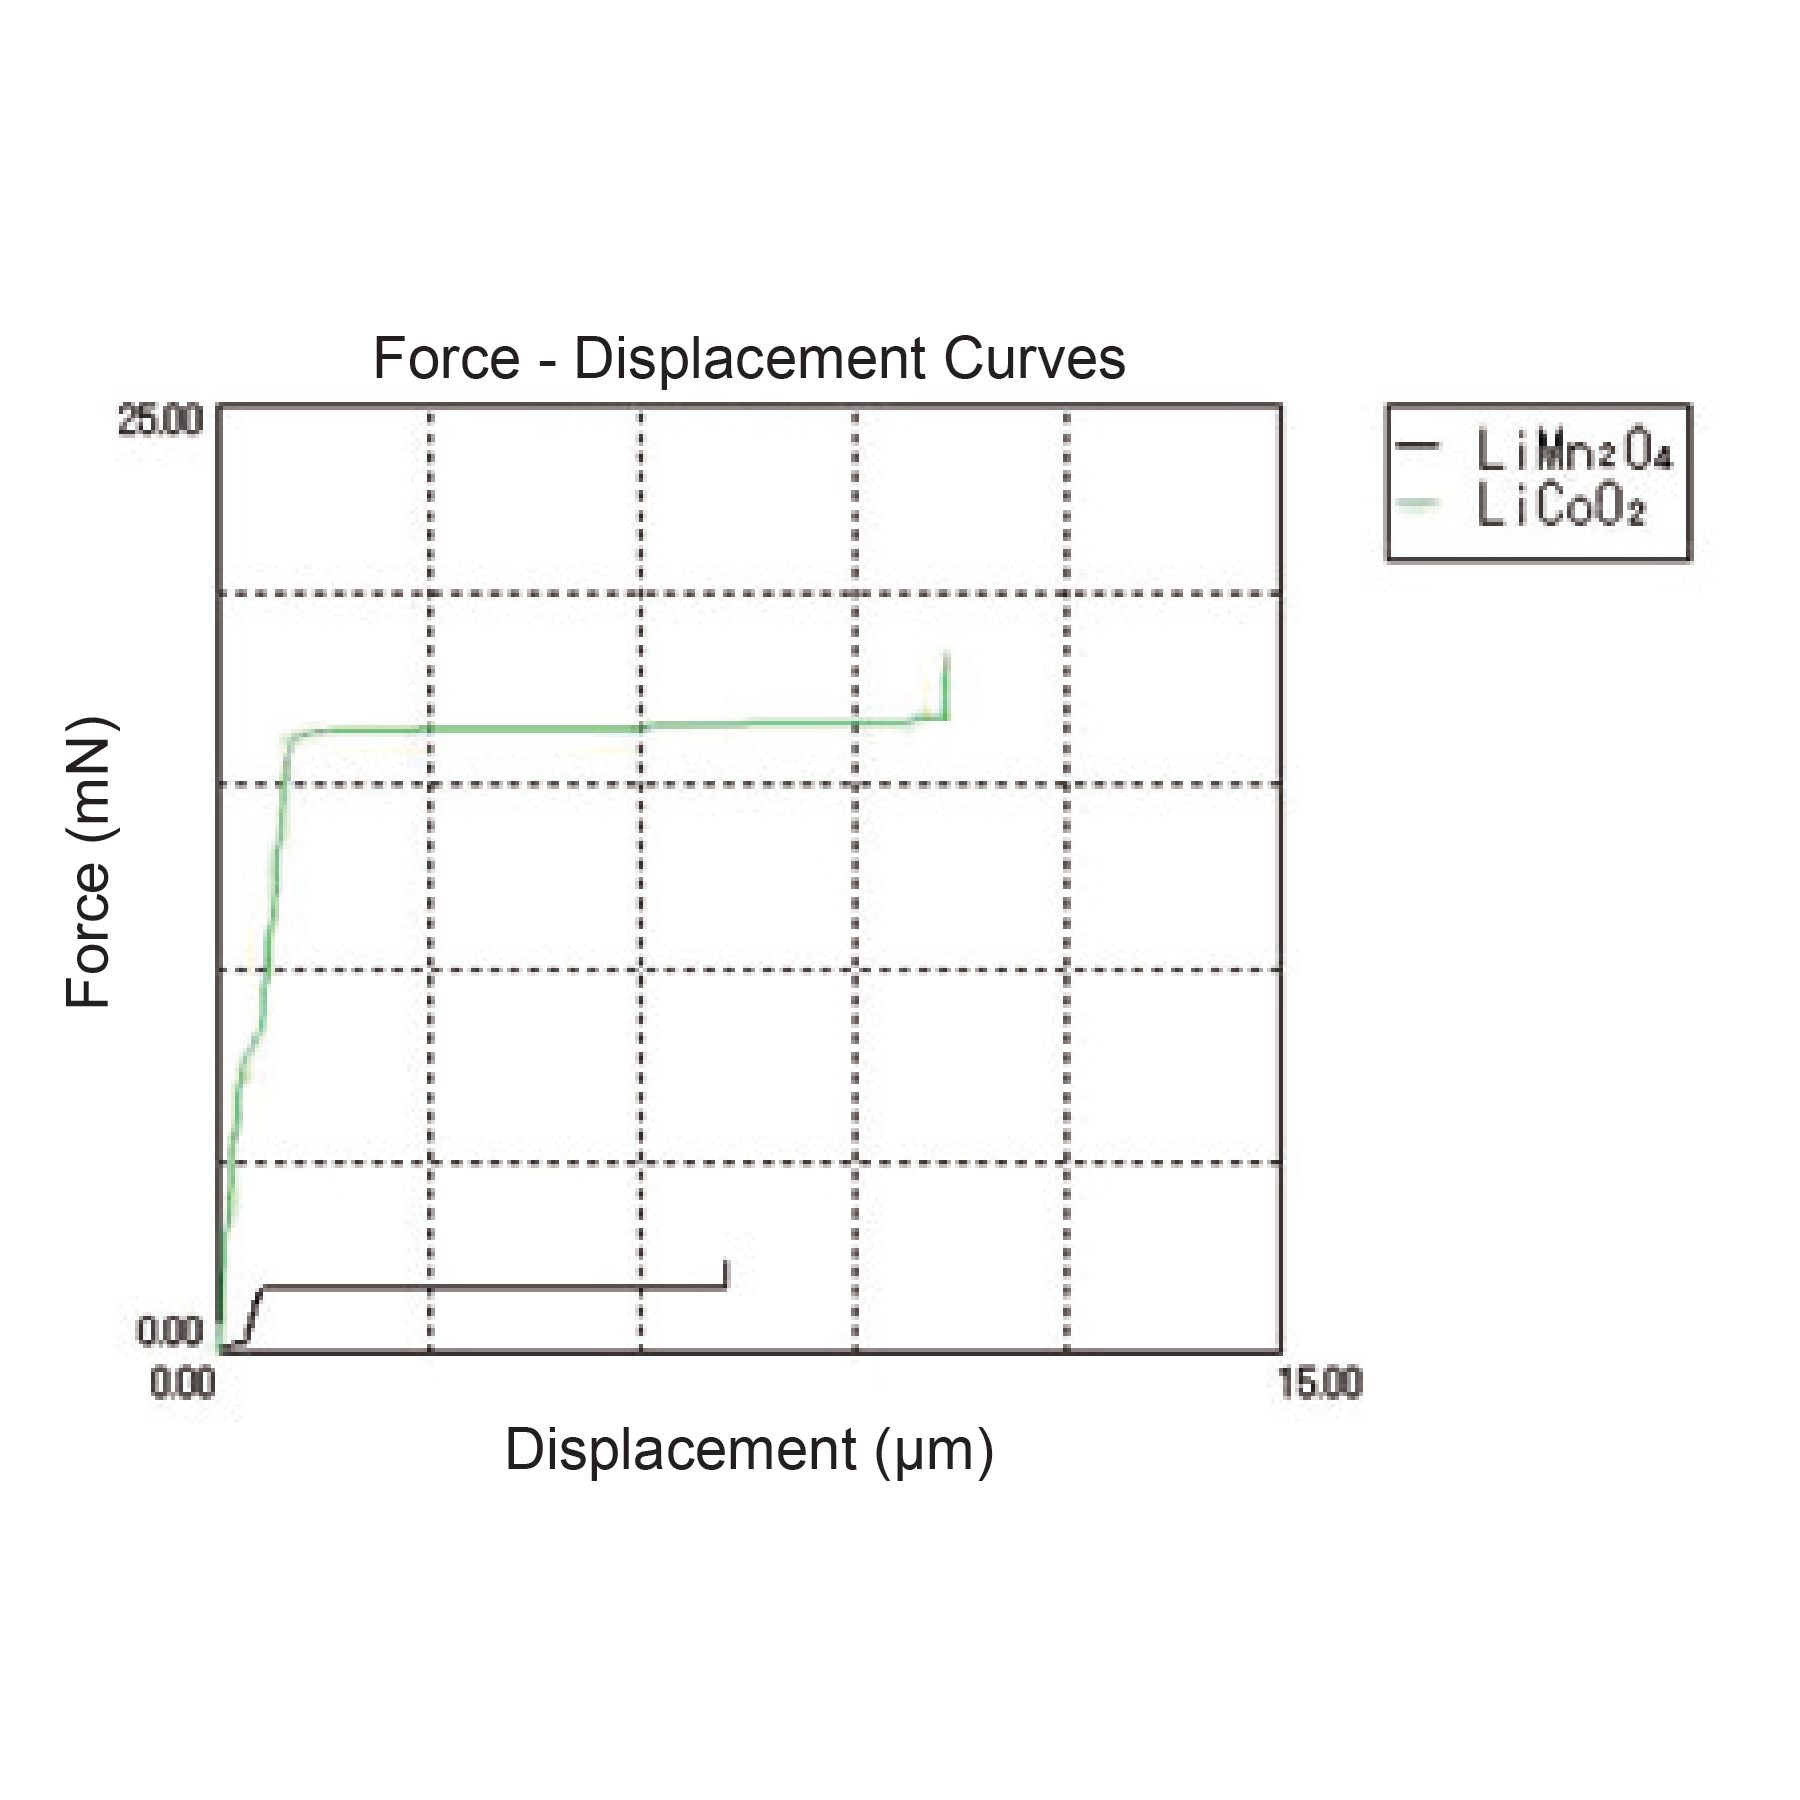
In this example the compressive strength of LiMn2O4 and LiCoO2 particles are compared. The samples were compressed using a test force of 50mN at a loading rate of 2.2mN/sec. The force displacement curve and calculated fracture strength values are shown in figure 6 and Table 1.
The horizontal portion of the force displacement graph clearly indicates the force at fracture. The fracture strength was calculated using equation 1 which is based on JIS R1639-5, Test method of properties of fine ceramic granules, Part 5 compressive strength of a single granule2. The values shown represent an average of ten individual particle measurements. A clear difference may be seen in the strength of the two materials.
Equation (1): Cs = 2.48 P/πd2
Where:
Cs: Strength (MPa)
P: Fracture force (N)
D: Particle diameter (mm)
Table 1: LiMn2O4 and LiCoO2 particle compression test results
Figure 6: Average force-displacement curve comparing LiMn2O4 and LiCoO2 particle strength
Example 2: Strength comparison of graphite anodes
In this example the compressive deformation strength of three different graphite anode materials is compared. The samples were compressed to a test force of 10mN at a loading rate of 0.2331 mN/sec.
When measuring soft materials such as graphite, the initial contact point of the indenter may be difficult to determine, and a clear fracture force may not be discernible from the force displacement graph. In these cases, the deformation strength may be calculated using the equation (2) based on JIS Z 8844 Test Method of Fracture and Deformation of a fine particle3.
Equation 2
σ10% = F10% /A
A = πd2/4
Where:
σ10% Deformation strength for 10% compression displacement (Pa)
F10% Force for a 10% compression displacement of particle size (N)
A Representative area (m2)
d Particle size (m)
Figure 7 shows the average force displacement graph for three graphite materials. The average size and deformation strength for 10% compression are shown in Table 2. The values represent an average of ten individual particle measurements. Video of the particle tests may be correlated to the force displacement curve. Figure 8 shows a time series of images taken from video of the compression of an individual particle. The associated graphs show the force and displacement for each image.
Table 2: Graphite anode compression average deformation strength σ10% results
Figure7: Average force-displacement curve comparing three graphite anode materials
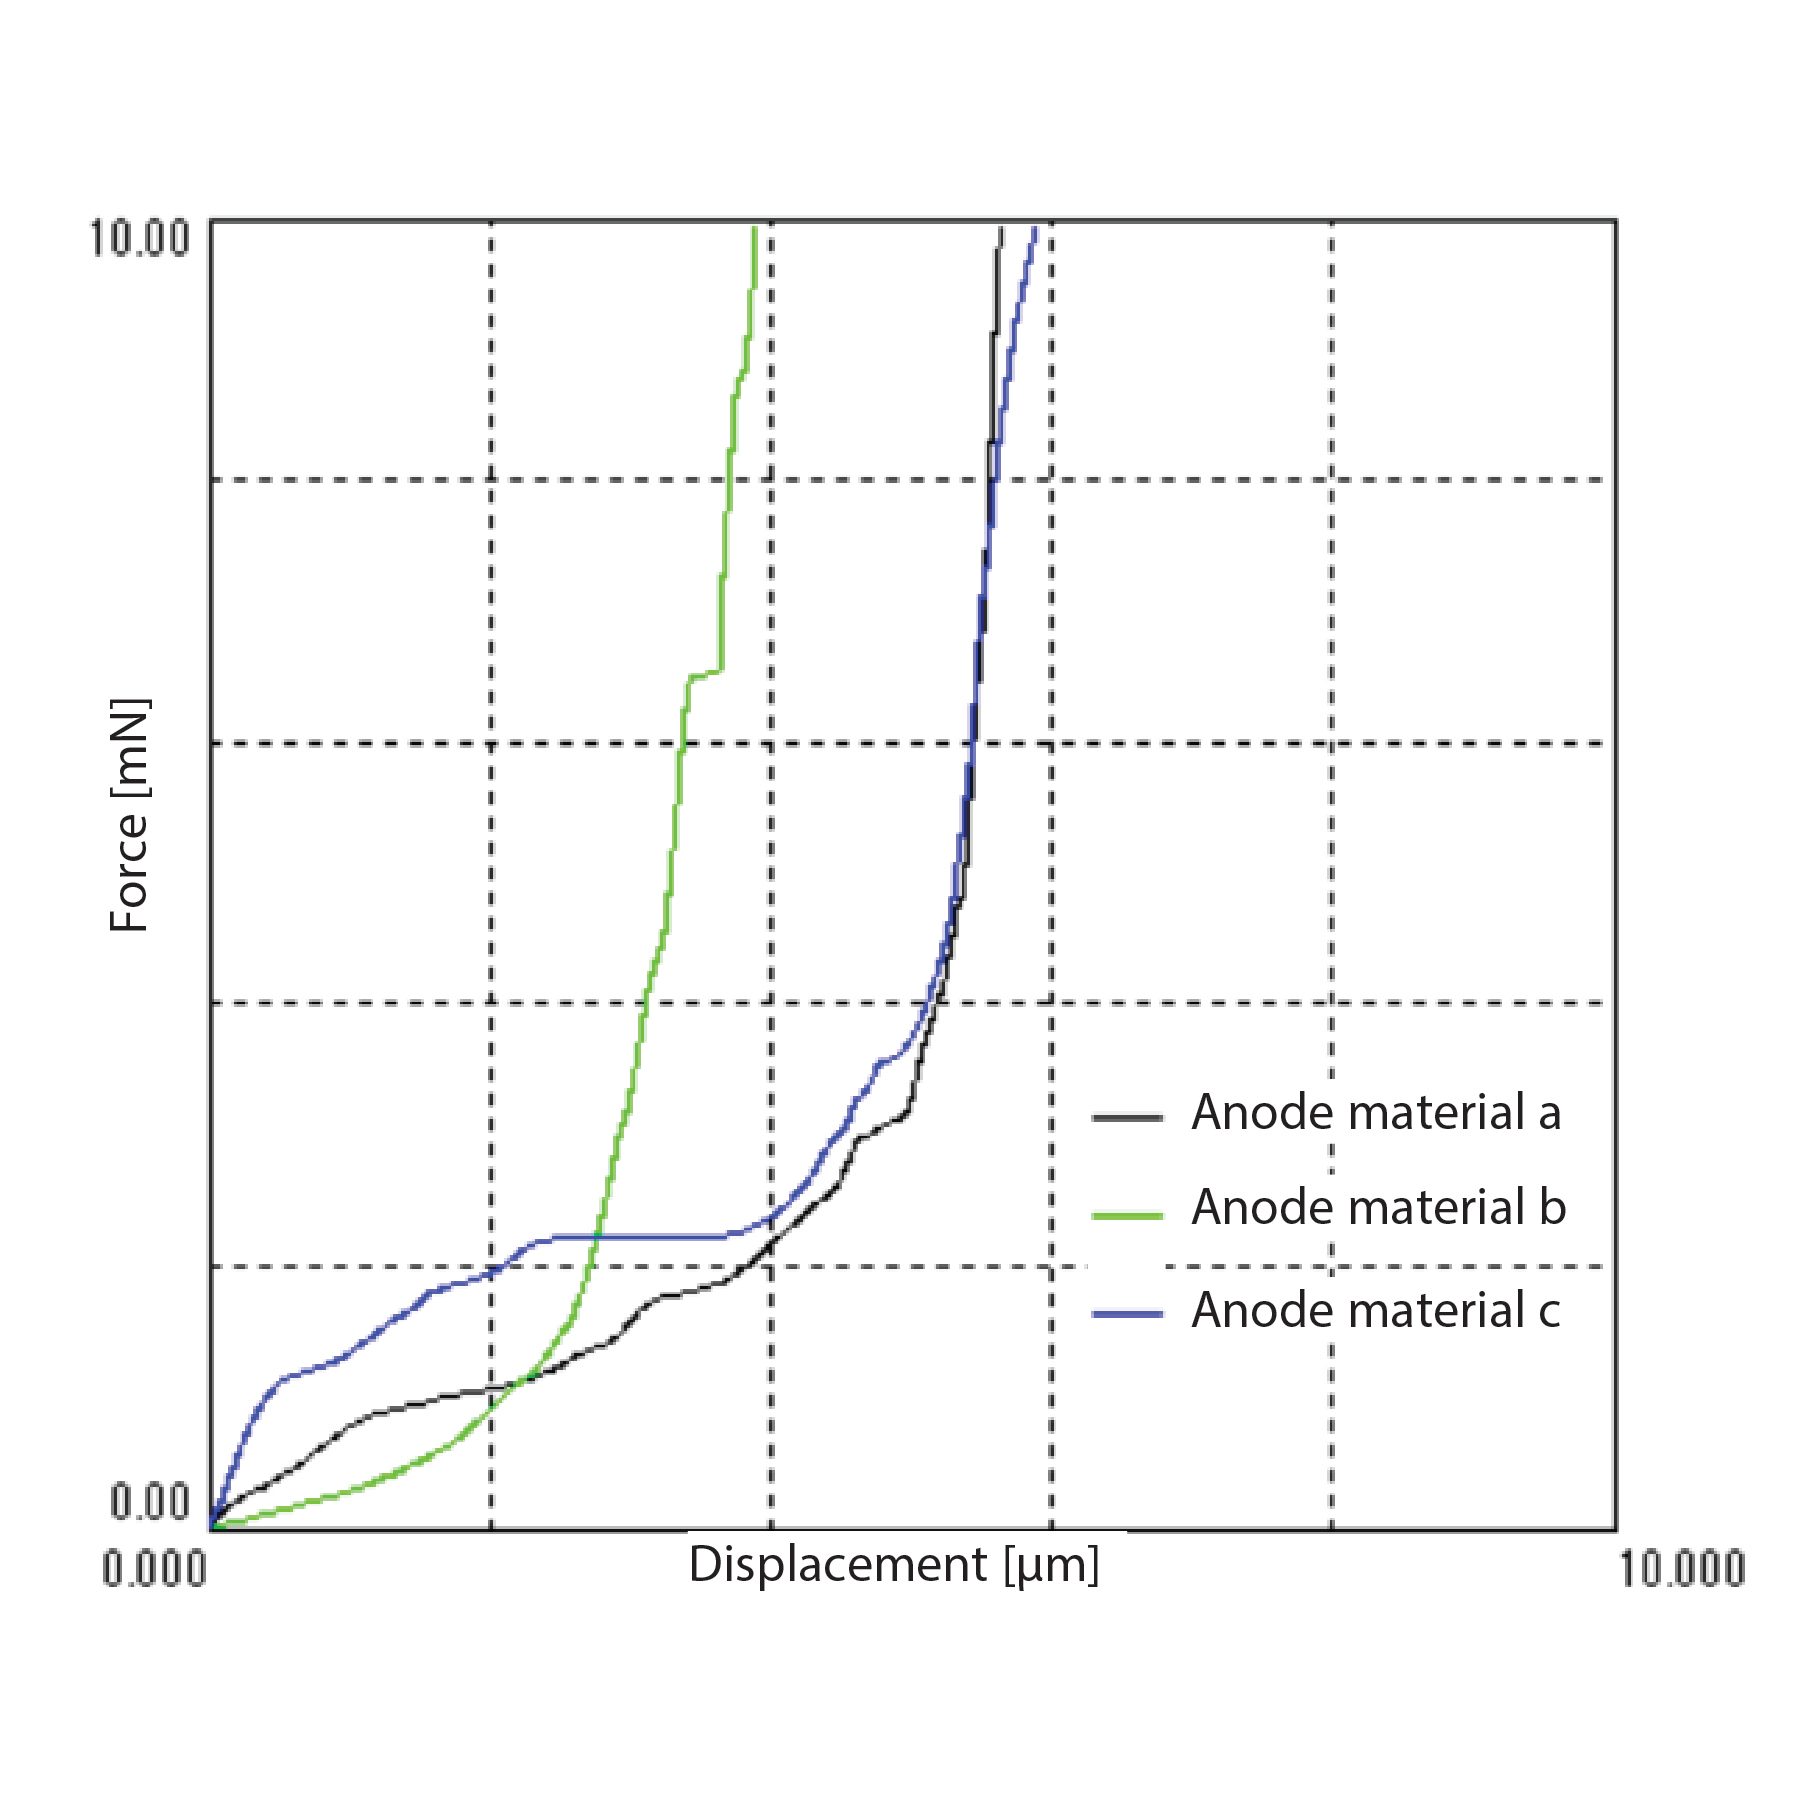
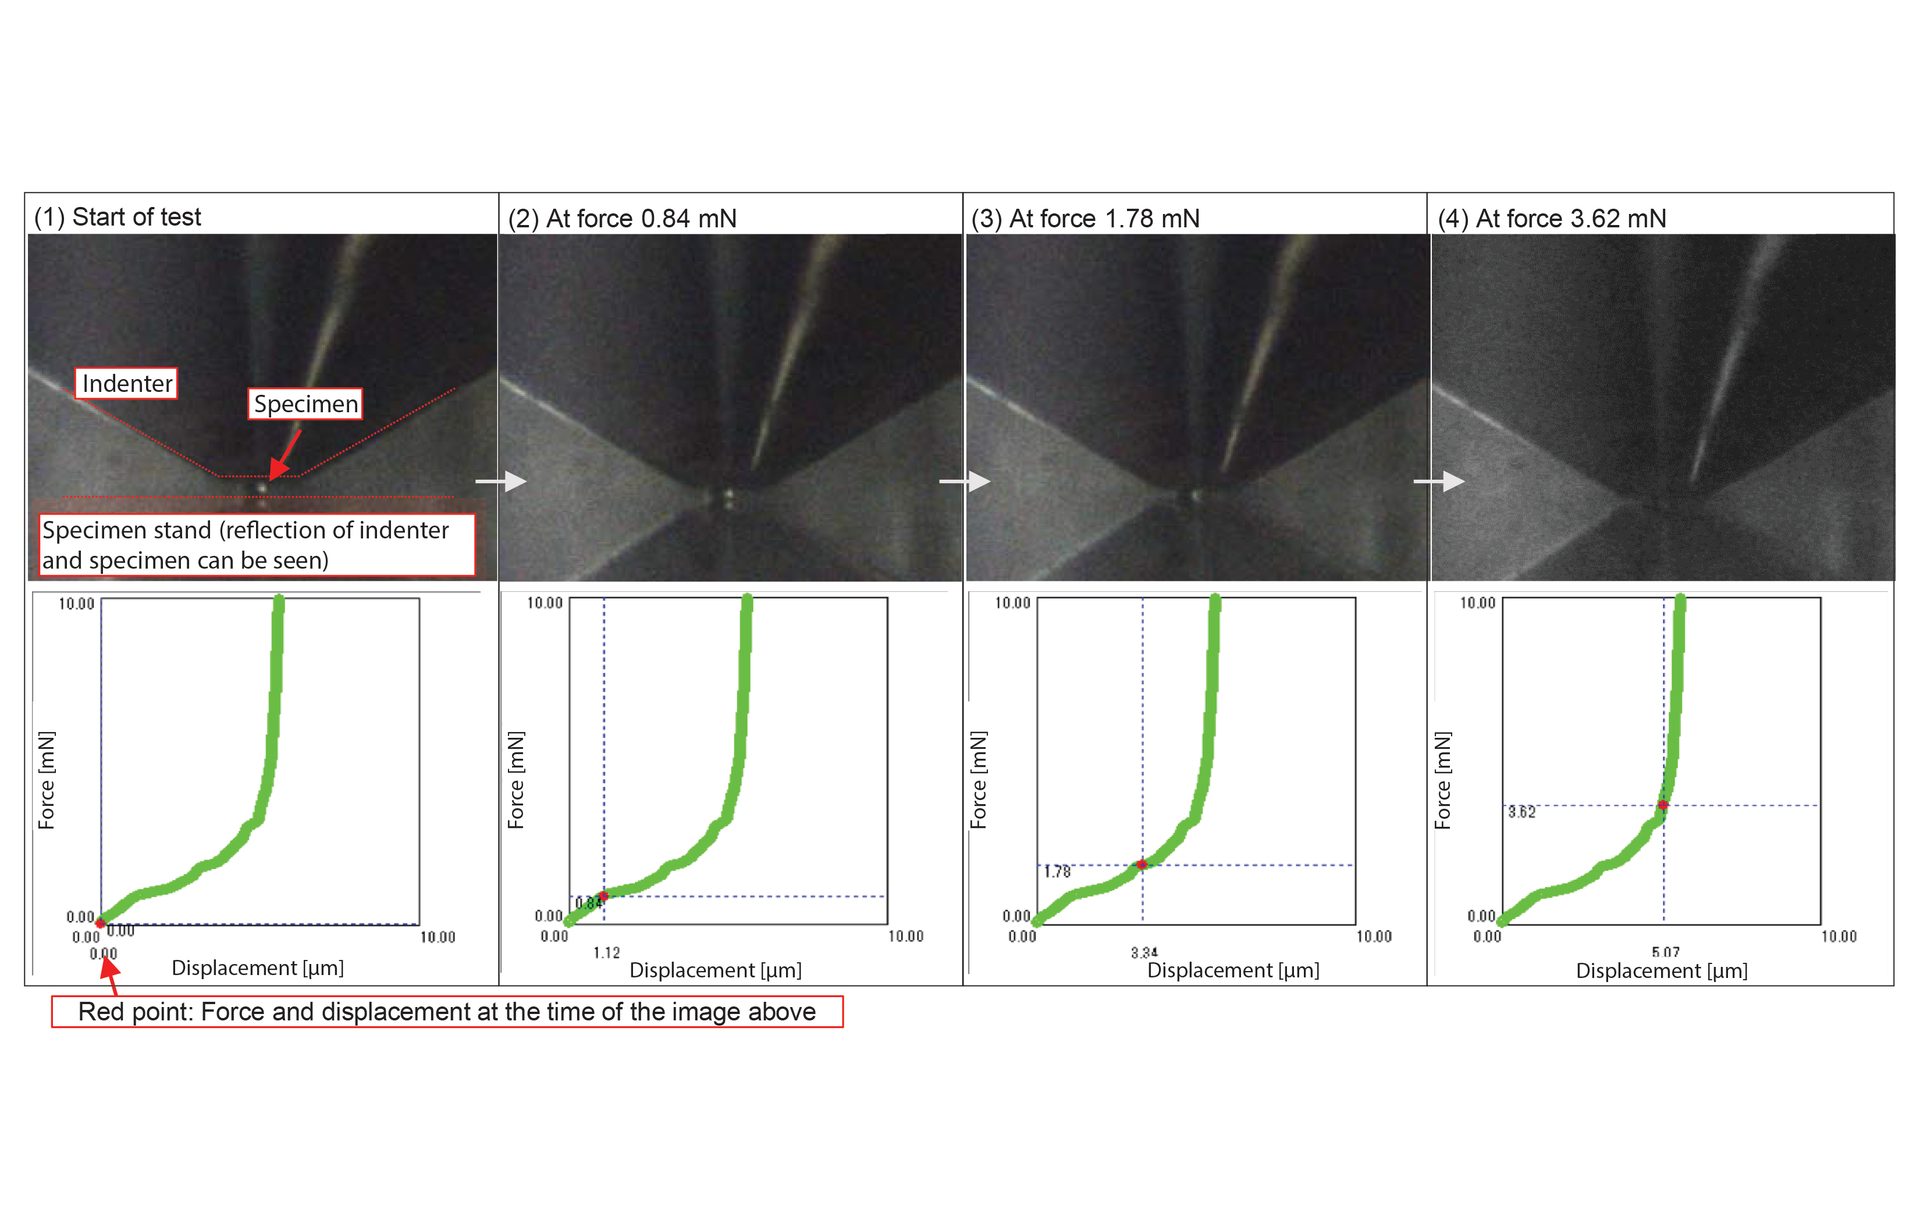
Figure 8: Images from video taken during compression test correlated with force-displacement curve.
Conclusion
These examples provide a basic guide to micro-compression testing of battery material particulates. For more detailed examples of how the techniques described above have been utilized to characterize battery materials, please see the references provided 1-7. A micro-compression tester is also useful to characterize many other important industrial materials. One example may be found in Hellsten et al8 which documents a detailed characterization of micro-spherical Si02 catalyst support material.
References:
- The correlation between particle hardness and cycle performance of layered cathode materials for lithium-ion batteries. Moon J., et al Journal of Power Sources 486, Feb. 2021
- Japanese Institute of Standards JIS R 1639-5, Test methods of properties of fine ceramic particles Part 5 Compressive strength of a single granule.
- Japanese Institute of Standards JIS Z 8844, Test method of fracture and deformation strength of a fine particle.
- Surface Stabilization of Ni-Rich Layered Cathode Materials via Surface Engineering with LiTaO3 for Lithium-ion Batteries, Hyo Ben Lee et al, ACS Applied Material Interfaces 2022, 14, 2, 2731-2741
- Incorporation of Titanium into Ni-Rich Layered Cathode Materials for Lithium-ion Batteries, Jong Hwa Kim et al, ACS Applied Energy Materials 2020, 3, 12 12204-112211
- Facile Mn Surface Doping of Ni-Rich Layered Cathode Materials for Lithium-Ion Batteries, Woosuk Cho et al, ACS Applied Material Interfaces 2018, 10, 45, 38915-38921
- Capacity fading behavior of Ni-rich layered cathode materials in Li-ion full cells, Hyang-Rim Kim et al, Journal of Electroanalytical Chemistry 2016, 782, 168-173
- Compressive Properties of Micro-spherical SiO2 Particles, Niko Hellsten et al, The Minerals, Metals & Minerals Society, Advances in Powder and Ceramic Materials Science 2020 B. Li, et al (eds.)
- Compression Tests for Anode Material for Lithium-Ion Batteries, Chika Oya, Shimadzu Corporation Application 01-00142-EN, December 2021.
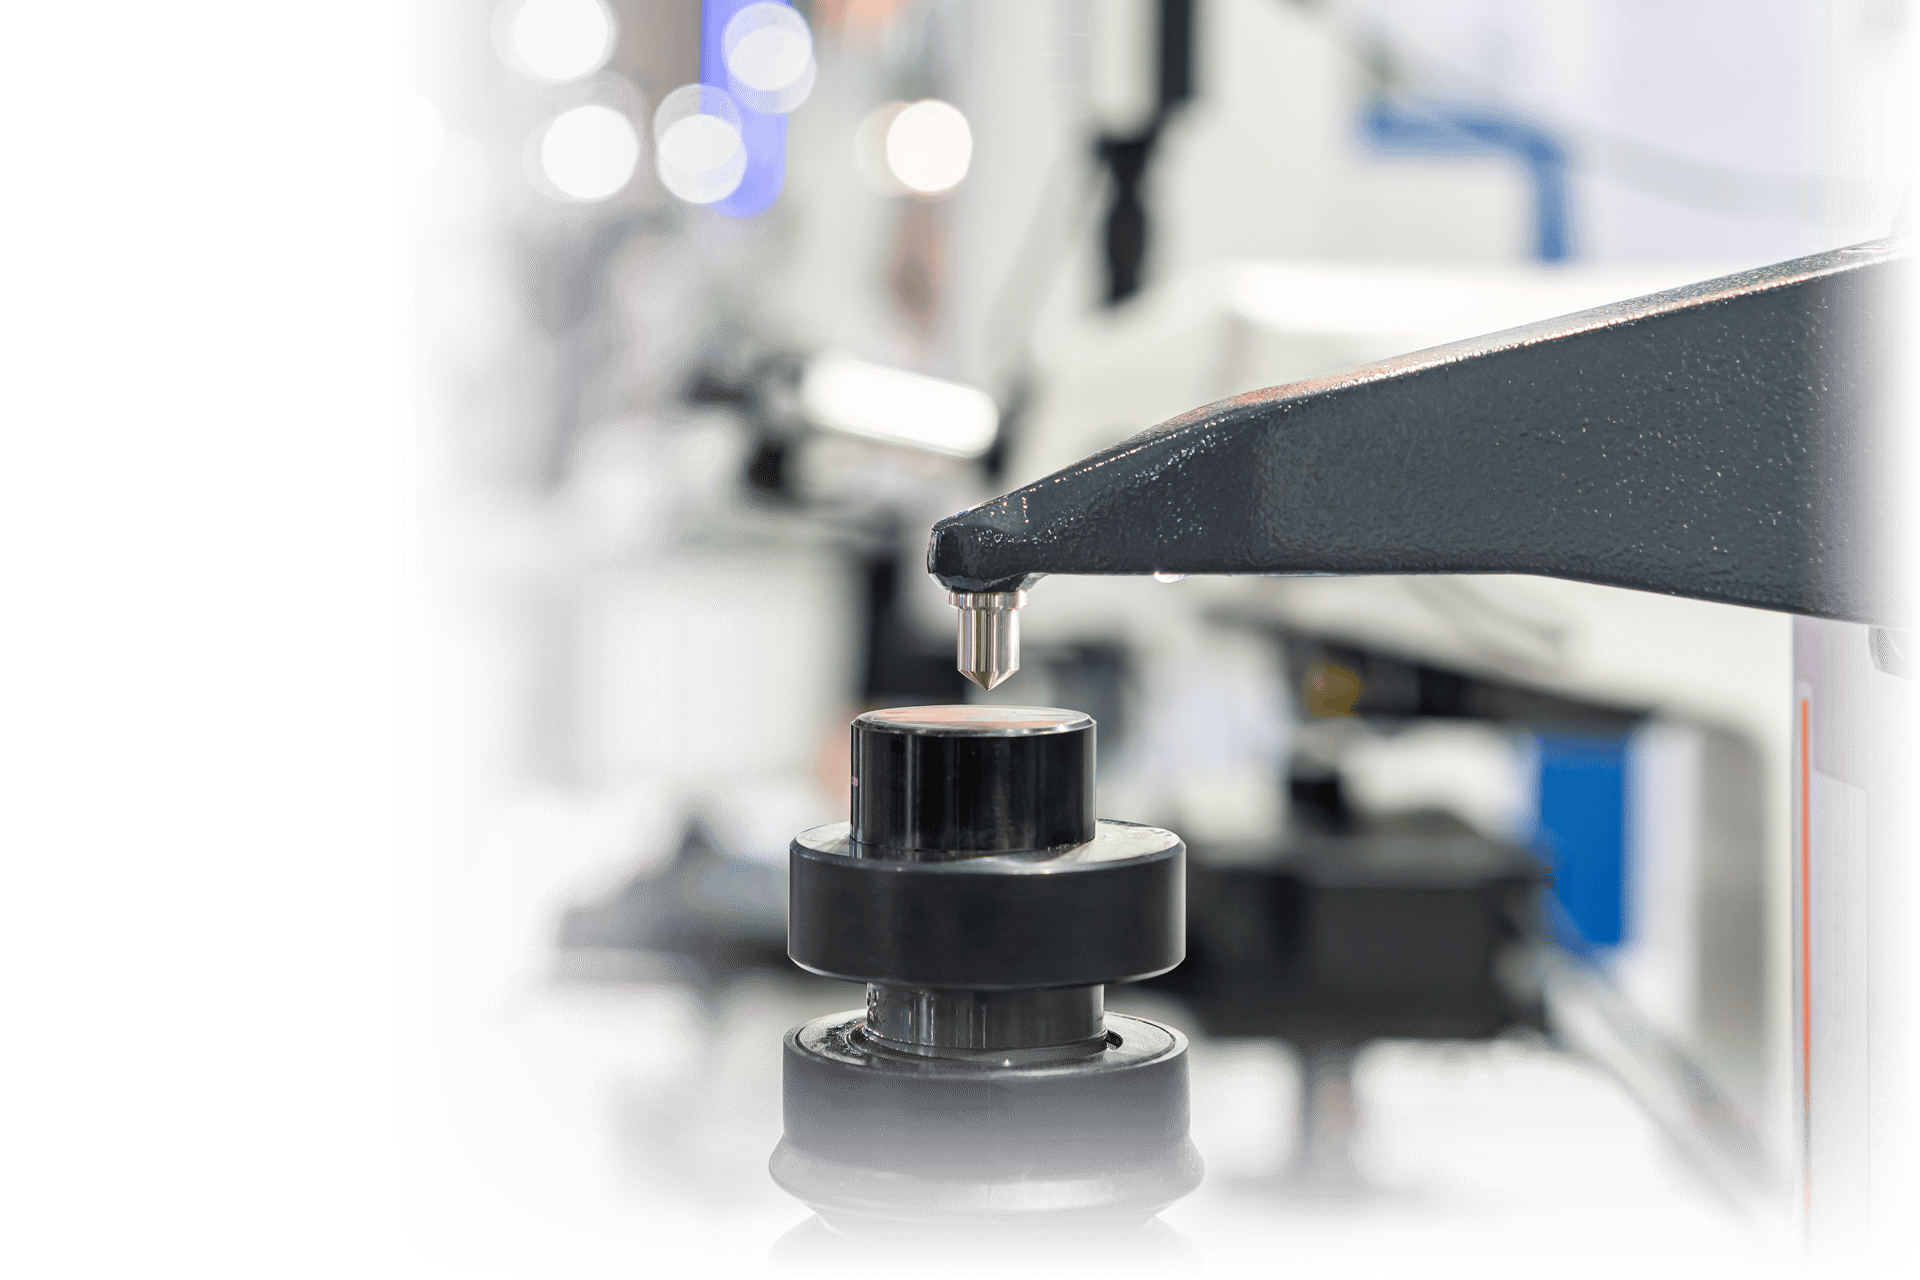
Opening Background Image Source: Andreas Sartison / iStock / Getty Images Plus via Getty Images.
Remaining Images Source: Shimadzu
Christopher Macey, Material Science Business Group Leader, Shimadzu Scientific Instruments, Columbia, MD. For more information, call (410) 910-0859 or email cjmacey@shimadzu.com.
April 2023 | Volume 62 | Number 4